OPEN-SOURCE SCRIPT
Tops & Bottoms by Volume [SS]
Hey everyone,
Releasing this indicator that helps you time entries by alerting to potential tops and bottoms in the market.
Background to the indicator:
I was playing around with things that signalled reversals / tops and bottoms in SPSS and R using Pivot Points to mark tops and bottoms. Happened to come across a generally statistically significant relationship between sell to buy volume that was tracked over 10 to 50 candles back and pivot highs and pivot lows.
So I put it into a beta version of an indicator to see how it looked and was a bit surprised.
Since then, I have went back and narrowed down the details of what works/what doesn't work and this is the tentative result!
What it does / How to Use:
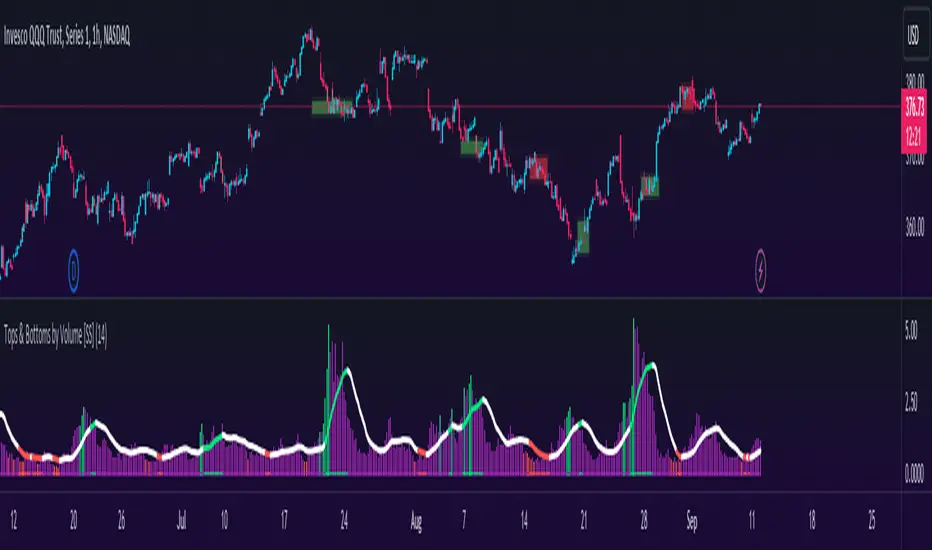
It tracks the cumulative buy vs sell volume. Buy volume is cumulated as close > open (or green candles) and sell is open > close (or red candles).
It then cumulates this over a user-defined period (defaulted to 14). It then looks back to see the highest vs lowest areas of sell and buy volume and makes determinations based on this relationship.
The relationship was determined by me using my own analysis and programmed into the indicators algorithm (using highest vs lowest function in pine).
It will plot areas of potential reversal to the upside as green on the histogram or red for a downside reversal. Once this becomes significant enough to signal an actual bottom or top, it will then change the SMA colour from white to green (for bottom) or red (for top).
Your entries generally should be once the SMA turns back to white. So from green to white, you would enter long or inverse for red to white (enter short).

Settings and Customizability:
Here are the key points to keep in mind if you are using this indicator:
Please read the instructions carefully.
If you require further assistance, I have posted a tutorial video.
Please be sure you are reading and/or watching carefully.
If you have questions, please feel free to post them below. But bear in mind I likely will not respond if it is already addressed in the description above (this happens often).
Also, feel free to leave your comments or suggestions below as well.
Thanks for checking this out. If you are interested in volume based trading, I suggest also checking out my Buyer to Seller volume indicator which cumulates total buying vs selling volume over a designated lookback period. Both of these used in conjunction are very powerful tools for volume based traders! (Available here)
NOTE:
The boxes drawn in the chart are my own for demonstration purposes. I unfortunately cannot get the indicator to overlay the boxes on the chart in a separate viewing pane. That is why I opted to use the barcolor function to change the candle color instead :-).
Thanks again everyone and safe trades!
Releasing this indicator that helps you time entries by alerting to potential tops and bottoms in the market.
Background to the indicator:
I was playing around with things that signalled reversals / tops and bottoms in SPSS and R using Pivot Points to mark tops and bottoms. Happened to come across a generally statistically significant relationship between sell to buy volume that was tracked over 10 to 50 candles back and pivot highs and pivot lows.
So I put it into a beta version of an indicator to see how it looked and was a bit surprised.
Since then, I have went back and narrowed down the details of what works/what doesn't work and this is the tentative result!
What it does / How to Use:
It tracks the cumulative buy vs sell volume. Buy volume is cumulated as close > open (or green candles) and sell is open > close (or red candles).
It then cumulates this over a user-defined period (defaulted to 14). It then looks back to see the highest vs lowest areas of sell and buy volume and makes determinations based on this relationship.
The relationship was determined by me using my own analysis and programmed into the indicators algorithm (using highest vs lowest function in pine).
It will plot areas of potential reversal to the upside as green on the histogram or red for a downside reversal. Once this becomes significant enough to signal an actual bottom or top, it will then change the SMA colour from white to green (for bottom) or red (for top).
Your entries generally should be once the SMA turns back to white. So from green to white, you would enter long or inverse for red to white (enter short).
Settings and Customizability:
Here are the key points to keep in mind if you are using this indicator:
- Your lookback length should be between 10 to 50. I have left it open for you to modify it below and above this lookback period; however, this is the major periods deemed to be significant in identifying tops and bottoms. Thus, I advise against operating outside of those parameters.
- You can toggle between smoothed look or historgram with SMA. The strength in this indicator comes from using the SMA and watching the SMA for signals of reversals, so if you want to filter out the background noise, you can simply look at the plotted SMA. If you want a more responsive indication of impending reversals, leave the smoothed option off and view the histogram in conjunction with the SMA.
- The indicator will change the candle colour to red for bearish reversal and green to bullish reversal. This is based on the SMA. You can toggle this off and/or on as desired.
- It is recommended to leave ETH (extended trading hours) turned off and RTH turned on.
Please read the instructions carefully.
If you require further assistance, I have posted a tutorial video.
Please be sure you are reading and/or watching carefully.
If you have questions, please feel free to post them below. But bear in mind I likely will not respond if it is already addressed in the description above (this happens often).
Also, feel free to leave your comments or suggestions below as well.
Thanks for checking this out. If you are interested in volume based trading, I suggest also checking out my Buyer to Seller volume indicator which cumulates total buying vs selling volume over a designated lookback period. Both of these used in conjunction are very powerful tools for volume based traders! (Available here)
NOTE:
The boxes drawn in the chart are my own for demonstration purposes. I unfortunately cannot get the indicator to overlay the boxes on the chart in a separate viewing pane. That is why I opted to use the barcolor function to change the candle color instead :-).
Thanks again everyone and safe trades!
오픈 소스 스크립트
트레이딩뷰의 진정한 정신에 따라, 이 스크립트의 작성자는 이를 오픈소스로 공개하여 트레이더들이 기능을 검토하고 검증할 수 있도록 했습니다. 작성자에게 찬사를 보냅니다! 이 코드는 무료로 사용할 수 있지만, 코드를 재게시하는 경우 하우스 룰이 적용된다는 점을 기억하세요.
Get:
- Live Updates,
- Discord access,
- Access to my Proprietary Merlin Software,
- Access to premium indicators,
patreon.com/steversteves
Now on X!
- Live Updates,
- Discord access,
- Access to my Proprietary Merlin Software,
- Access to premium indicators,
patreon.com/steversteves
Now on X!
면책사항
해당 정보와 게시물은 금융, 투자, 트레이딩 또는 기타 유형의 조언이나 권장 사항으로 간주되지 않으며, 트레이딩뷰에서 제공하거나 보증하는 것이 아닙니다. 자세한 내용은 이용 약관을 참조하세요.