PROTECTED SOURCE SCRIPT
Brekout Up/Dn 9:15 Candle
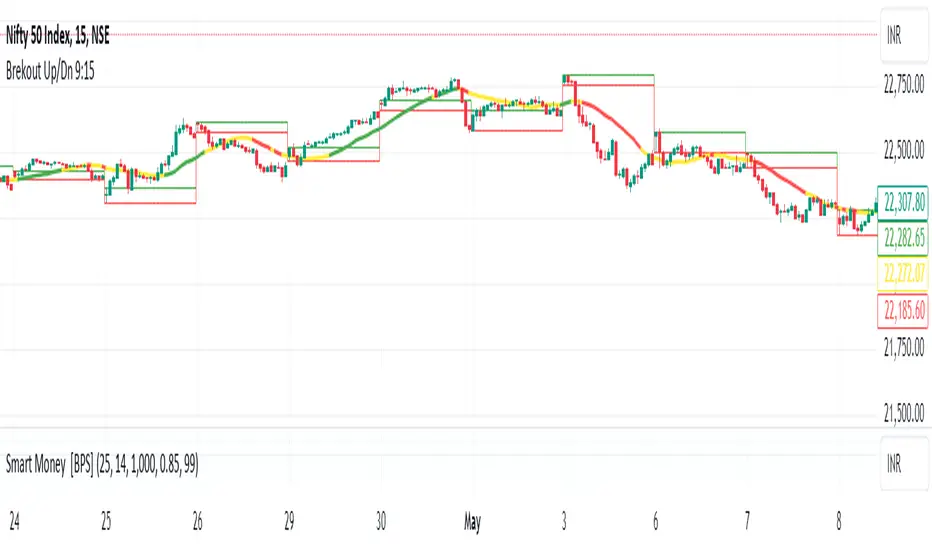
Certainly! Let’s break down the concepts of “Breakout Up/Dn 9:15” and the Relative Strength Index (RSI):
Breakout Up/Dn 9:15:
This refers to a stock breakout strategy that occurs within the first 15 minutes of the trading day (between 9:15 AM and 9:20 AM).
The goal is to identify strong support or resistance levels during this early market activity.
The following filters are typically applied to stocks in the cash segment:
The 15-minute closing price must be greater than the 15-minute maximum of either the last 20 closing prices or the current closing price.
The 15-minute volume should be higher than the 15-minute simple moving average (SMA) of volume over the past 20 periods.
The daily closing price should be less than or equal to a specified value (e.g., 2000).
The 15-minute RSI (14-period) should be greater than or equal to a certain threshold (e.g., 75).
If a stock meets all these conditions, it is considered a breakout candidate.
Note that this scan is based on delayed data, and real-time scans are available with a premium subscription1.
Relative Strength Index (RSI):
The RSI is a momentum oscillator that measures the speed and change of price movements.
It ranges from 0 to 100 and is commonly used to identify overbought or oversold conditions.
Key points about RSI:
RSI values above 70 indicate overbought conditions (potential reversal downward).
RSI values below 30 indicate oversold conditions (potential reversal upward).
Traders often look for RSI crossovers, divergences, and retests of breakout levels.
RSI can be used in various trading strategies, including breakout retests and alerts2.
Remember that these are just brief descriptions, and there’s much more to explore in both breakout strategies
보호된 스크립트입니다
이 스크립트는 비공개 소스로 게시됩니다. 하지만 제한 없이 자유롭게 사용할 수 있습니다 — 여기에서 자세히 알아보기.
면책사항
이 정보와 게시물은 TradingView에서 제공하거나 보증하는 금융, 투자, 거래 또는 기타 유형의 조언이나 권고 사항을 의미하거나 구성하지 않습니다. 자세한 내용은 이용 약관을 참고하세요.
보호된 스크립트입니다
이 스크립트는 비공개 소스로 게시됩니다. 하지만 제한 없이 자유롭게 사용할 수 있습니다 — 여기에서 자세히 알아보기.
면책사항
이 정보와 게시물은 TradingView에서 제공하거나 보증하는 금융, 투자, 거래 또는 기타 유형의 조언이나 권고 사항을 의미하거나 구성하지 않습니다. 자세한 내용은 이용 약관을 참고하세요.