PROTECTED SOURCE SCRIPT
SG Momentum
Hello All,
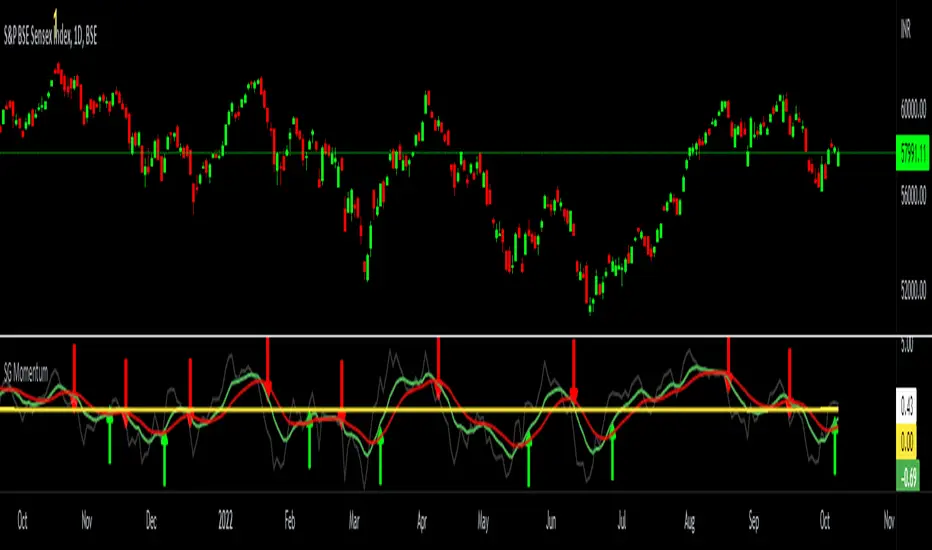
I have made a momentum indicator based on the distance from exponential moving average. This captures both buy and sell cycles effectively. The logic is to calculate the distance of closing price from an exponential moving average ( I use 13 period - You are free to choose any other period) - this is the dim grey line which you can toggle off too. Then I smoothen this by calculating a 9-period EMA of the same (the green line). I further slow it down by another 9-period EMA of the same ( the red line). Now when the green lines crosses the red line from below 0 it signifies a new bull cycle and vice versa for bear cycle. This works across all timeframes. I have marked few signals in the below chart for your reference.

I have made a momentum indicator based on the distance from exponential moving average. This captures both buy and sell cycles effectively. The logic is to calculate the distance of closing price from an exponential moving average ( I use 13 period - You are free to choose any other period) - this is the dim grey line which you can toggle off too. Then I smoothen this by calculating a 9-period EMA of the same (the green line). I further slow it down by another 9-period EMA of the same ( the red line). Now when the green lines crosses the red line from below 0 it signifies a new bull cycle and vice versa for bear cycle. This works across all timeframes. I have marked few signals in the below chart for your reference.
보호된 스크립트입니다
이 스크립트는 비공개 소스로 게시됩니다. 하지만 이를 자유롭게 제한 없이 사용할 수 있습니다 – 자세한 내용은 여기에서 확인하세요.
면책사항
해당 정보와 게시물은 금융, 투자, 트레이딩 또는 기타 유형의 조언이나 권장 사항으로 간주되지 않으며, 트레이딩뷰에서 제공하거나 보증하는 것이 아닙니다. 자세한 내용은 이용 약관을 참조하세요.
보호된 스크립트입니다
이 스크립트는 비공개 소스로 게시됩니다. 하지만 이를 자유롭게 제한 없이 사용할 수 있습니다 – 자세한 내용은 여기에서 확인하세요.
면책사항
해당 정보와 게시물은 금융, 투자, 트레이딩 또는 기타 유형의 조언이나 권장 사항으로 간주되지 않으며, 트레이딩뷰에서 제공하거나 보증하는 것이 아닙니다. 자세한 내용은 이용 약관을 참조하세요.