PROTECTED SOURCE SCRIPT
New Price Highs/Lows (plotted on RSI)
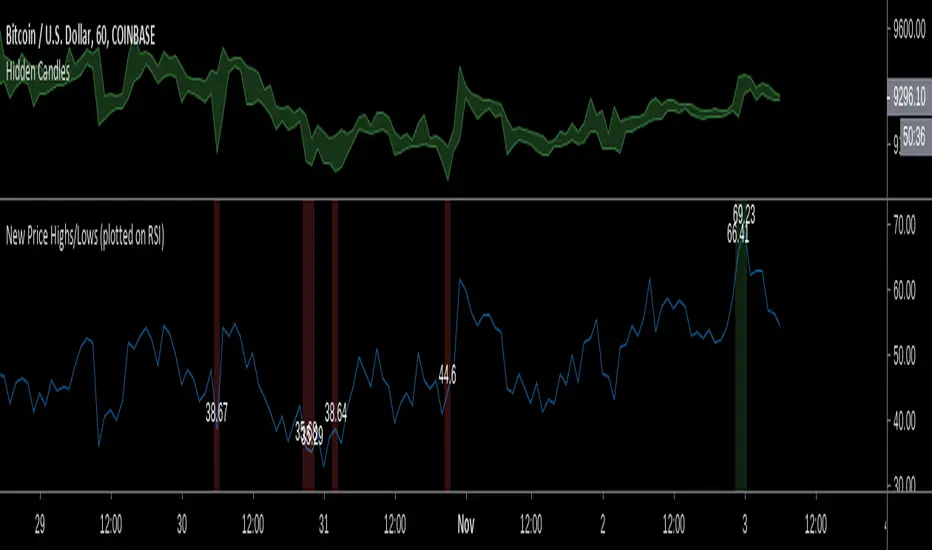
Rather than rely on existing indicators for bullish/bearish divergence, I'd rather just identify it myself.
This indicator just makes this easier to see (hands-free) the relevant data on the RSI at points where the price hits new highs/lows by colouring the background on the RSI based on price action and also plotting the RSI values at those points so you dont need to keep hovering over the RSI with your mouse.
Stay aware of your lookback setting because it will effect how often the new price highs/lows are highlighted.
보호된 스크립트입니다
이 스크립트는 비공개 소스로 게시됩니다. 하지만 제한 없이 자유롭게 사용할 수 있습니다 — 여기에서 자세히 알아보기.
면책사항
이 정보와 게시물은 TradingView에서 제공하거나 보증하는 금융, 투자, 거래 또는 기타 유형의 조언이나 권고 사항을 의미하거나 구성하지 않습니다. 자세한 내용은 이용 약관을 참고하세요.
면책사항
이 정보와 게시물은 TradingView에서 제공하거나 보증하는 금융, 투자, 거래 또는 기타 유형의 조언이나 권고 사항을 의미하거나 구성하지 않습니다. 자세한 내용은 이용 약관을 참고하세요.