OPEN-SOURCE SCRIPT
업데이트됨 Trinity Multi-Timeframe MA Trend
Original script can be found here: {Multi-Timeframe Trend Analysis [BigBeluga]} tradingview.com/script/zfkp3wZA-Multi-Timeframe-Trend-Analysis-BigBeluga/$0
1. all credit the original author tradingview.com/u/BigBeluga/
2. why change this script:
- added full transparency function to each EMA
- changed to up and down arrows
- change the dashboard to be able to resize and reposition
How to Use This Indicator
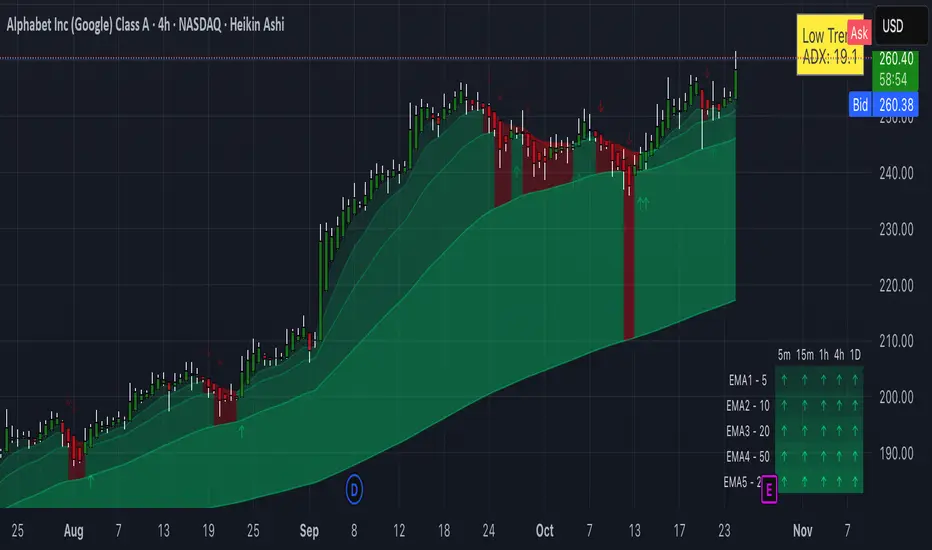
This indicator, "Trinity Multi-Timeframe MA Trend," is designed for TradingView and helps visualize Exponential Moving Average (EMA) trends across multiple timeframes. It plots EMAs on your chart, fills areas between them with directional colors (up or down), shows crossover/crossunder labels, and displays a dashboard table summarizing EMA directions (bullish ↑ or bearish ↓) for selected timeframes. It's useful for multi-timeframe analysis in trading strategies, like confirming trends before entries.
Configure Settings (via the Gear Icon on the Indicator Title):
Timeframes Group: Set up to 5 custom timeframes (e.g., "5" for 5 minutes, "60" for 1 hour). These determine the multi-timeframe analysis in the dashboard. Defaults: 5m, 15m, 1h, 4h, 5h.
EMA Group: Adjust the lengths of the 5 EMAs (defaults: 5, 10, 20, 50, 200). These are the moving averages plotted on the chart.
Colors (Inline "c"): Choose uptrend color (default: lime/green) and downtrend color (default: purple). These apply to plots, fills, labels, and dashboard cells.
Transparencies Group: Set transparency levels (0-100) for each EMA's plot and fill (0 = opaque, 100 = fully transparent). Defaults decrease from EMA1 (80) to EMA5 (0) for a gradient effect.
Dashboard Settings Group (newly added):
Dashboard Position: Select where the table appears (Top Right, Top Left, Bottom Right, Bottom Left).
Dashboard Size: Choose text size (Tiny, Small, Normal, Large, Huge) to scale the table for better visibility on crowded charts.
Understanding the Visuals:
EMA Plots: Five colored lines on the chart (EMA1 shortest, EMA5 longest). Color changes based on direction: uptrend (your selected up color) if rising, downtrend (down color) if falling.
Fills Between EMAs: Shaded areas between consecutive EMAs, colored and transparent based on the faster EMA's direction and your transparency settings.
Crossover Labels: Arrow labels (↑ for crossover/uptrend start, ↓ for crossunder/downtrend start) appear on the chart at EMA direction changes, with tooltips like "EMA1".
Dashboard Table (top-right by default):
Rows: EMA1 to EMA5 (with lengths shown).
Columns: Selected timeframes (converted to readable format, e.g., "5m", "1h").
Cells: ↑ (bullish/up) or ↓ (bearish/down) arrows, colored green/lime or purple based on trend, with fading transparency for visual hierarchy.
Use this to quickly check alignment across timeframes (e.g., all ↑ in multiple TFs might signal a strong uptrend).
Trading Tips:
Trend Confirmation: Look for alignment where most EMAs in higher timeframes are ↑ (bullish) or ↓ (bearish).
Entries/Exits: Use crossovers on the chart EMAs as signals, confirmed by the dashboard (e.g., enter long if lower TF EMA crosses up and higher TFs are aligned).
Customization: On lower timeframe charts, set dashboard timeframes to higher ones for top-down analysis. Adjust transparencies to avoid chart clutter.
Limitations: This is a trend-following tool; combine with volume, support/resistance, or other indicators. Backtest on historical data before live use.
Performance: Works best on trending markets; may whipsaw in sideways conditions.
1. all credit the original author tradingview.com/u/BigBeluga/
2. why change this script:
- added full transparency function to each EMA
- changed to up and down arrows
- change the dashboard to be able to resize and reposition
How to Use This Indicator
This indicator, "Trinity Multi-Timeframe MA Trend," is designed for TradingView and helps visualize Exponential Moving Average (EMA) trends across multiple timeframes. It plots EMAs on your chart, fills areas between them with directional colors (up or down), shows crossover/crossunder labels, and displays a dashboard table summarizing EMA directions (bullish ↑ or bearish ↓) for selected timeframes. It's useful for multi-timeframe analysis in trading strategies, like confirming trends before entries.
Configure Settings (via the Gear Icon on the Indicator Title):
Timeframes Group: Set up to 5 custom timeframes (e.g., "5" for 5 minutes, "60" for 1 hour). These determine the multi-timeframe analysis in the dashboard. Defaults: 5m, 15m, 1h, 4h, 5h.
EMA Group: Adjust the lengths of the 5 EMAs (defaults: 5, 10, 20, 50, 200). These are the moving averages plotted on the chart.
Colors (Inline "c"): Choose uptrend color (default: lime/green) and downtrend color (default: purple). These apply to plots, fills, labels, and dashboard cells.
Transparencies Group: Set transparency levels (0-100) for each EMA's plot and fill (0 = opaque, 100 = fully transparent). Defaults decrease from EMA1 (80) to EMA5 (0) for a gradient effect.
Dashboard Settings Group (newly added):
Dashboard Position: Select where the table appears (Top Right, Top Left, Bottom Right, Bottom Left).
Dashboard Size: Choose text size (Tiny, Small, Normal, Large, Huge) to scale the table for better visibility on crowded charts.
Understanding the Visuals:
EMA Plots: Five colored lines on the chart (EMA1 shortest, EMA5 longest). Color changes based on direction: uptrend (your selected up color) if rising, downtrend (down color) if falling.
Fills Between EMAs: Shaded areas between consecutive EMAs, colored and transparent based on the faster EMA's direction and your transparency settings.
Crossover Labels: Arrow labels (↑ for crossover/uptrend start, ↓ for crossunder/downtrend start) appear on the chart at EMA direction changes, with tooltips like "EMA1".
Dashboard Table (top-right by default):
Rows: EMA1 to EMA5 (with lengths shown).
Columns: Selected timeframes (converted to readable format, e.g., "5m", "1h").
Cells: ↑ (bullish/up) or ↓ (bearish/down) arrows, colored green/lime or purple based on trend, with fading transparency for visual hierarchy.
Use this to quickly check alignment across timeframes (e.g., all ↑ in multiple TFs might signal a strong uptrend).
Trading Tips:
Trend Confirmation: Look for alignment where most EMAs in higher timeframes are ↑ (bullish) or ↓ (bearish).
Entries/Exits: Use crossovers on the chart EMAs as signals, confirmed by the dashboard (e.g., enter long if lower TF EMA crosses up and higher TFs are aligned).
Customization: On lower timeframe charts, set dashboard timeframes to higher ones for top-down analysis. Adjust transparencies to avoid chart clutter.
Limitations: This is a trend-following tool; combine with volume, support/resistance, or other indicators. Backtest on historical data before live use.
Performance: Works best on trending markets; may whipsaw in sideways conditions.
릴리즈 노트
MA Type Selection: Users can now choose between EMA, SMA, or HMA for each of the 5 moving averages.Enable/Disable Options: to toggle visibility of each MA (lines, fills, arrows, and dashboard rows).
Dynamic Dashboard: The dashboard now dynamically adjusts rows based on enabled MAs, excluding disabled ones. If no MAs are enabled, it displays "No MAs enabled" instead of disappearing.
릴리즈 노트
I fixed an out-of-bounds error in the table by addressing a variable accumulation issue with row_count. Previously, it was declared with var inside the barstate.islast block, which caused it to increment repeatedly across script updates without resetting, eventually exceeding the fixed 6-row table limit. I adjusted the table.clear to use the dynamic row_count for the row range.This prevents the row index from going beyond the table's bounds, even during realtime updates or long historical bars.
오픈 소스 스크립트
트레이딩뷰의 진정한 정신에 따라, 이 스크립트의 작성자는 이를 오픈소스로 공개하여 트레이더들이 기능을 검토하고 검증할 수 있도록 했습니다. 작성자에게 찬사를 보냅니다! 이 코드는 무료로 사용할 수 있지만, 코드를 재게시하는 경우 하우스 룰이 적용된다는 점을 기억하세요.
면책사항
해당 정보와 게시물은 금융, 투자, 트레이딩 또는 기타 유형의 조언이나 권장 사항으로 간주되지 않으며, 트레이딩뷰에서 제공하거나 보증하는 것이 아닙니다. 자세한 내용은 이용 약관을 참조하세요.
오픈 소스 스크립트
트레이딩뷰의 진정한 정신에 따라, 이 스크립트의 작성자는 이를 오픈소스로 공개하여 트레이더들이 기능을 검토하고 검증할 수 있도록 했습니다. 작성자에게 찬사를 보냅니다! 이 코드는 무료로 사용할 수 있지만, 코드를 재게시하는 경우 하우스 룰이 적용된다는 점을 기억하세요.
면책사항
해당 정보와 게시물은 금융, 투자, 트레이딩 또는 기타 유형의 조언이나 권장 사항으로 간주되지 않으며, 트레이딩뷰에서 제공하거나 보증하는 것이 아닙니다. 자세한 내용은 이용 약관을 참조하세요.