OPEN-SOURCE SCRIPT
업데이트됨 Adaptive Parabolic SAR (PSAR) [Loxx]
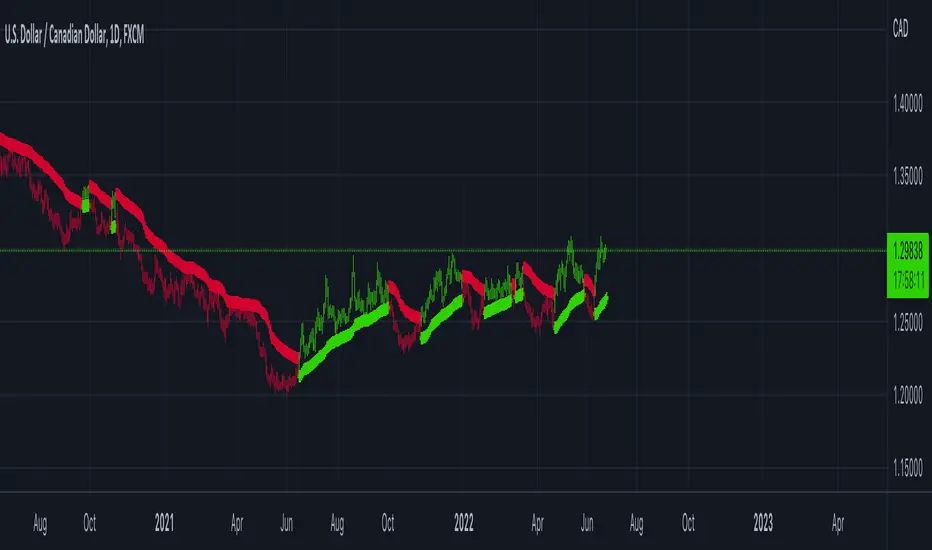
Adaptive Parabolic SAR (PSAR) [Loxx] is an advanced Parabolic SAR with adaptive adjustments using either a Kaufman or an Ehlers smoothing algorithms.
What is the Parabolic SAR?
The parabolic SAR attempts to give traders an edge by highlighting the direction an asset is moving, as well as providing entry and exit points. In this article, we'll look at the basics of this indicator and show you how you can incorporate it into your trading strategy. We'll also look at some of the drawbacks of the indicator.
The parabolic SAR is a technical indicator used to determine the price direction of an asset, as well as draw attention to when the price direction is changing. Sometimes known as the "stop and reversal system," the parabolic SAR was developed by J. Welles Wilder Jr., creator of the relative strength index (RSI).1
On a chart, the indicator appears as a series of dots placed either above or below the price bars. A dot below the price is deemed to be a bullish signal. Conversely, a dot above the price is used to illustrate that the bears are in control and that the momentum is likely to remain downward. When the dots flip, it indicates that a potential change in price direction is under way. For example, if the dots are above the price, when they flip below the price, it could signal a further rise in price.
Additional Options
Enjoy!
What is the Parabolic SAR?
The parabolic SAR attempts to give traders an edge by highlighting the direction an asset is moving, as well as providing entry and exit points. In this article, we'll look at the basics of this indicator and show you how you can incorporate it into your trading strategy. We'll also look at some of the drawbacks of the indicator.
The parabolic SAR is a technical indicator used to determine the price direction of an asset, as well as draw attention to when the price direction is changing. Sometimes known as the "stop and reversal system," the parabolic SAR was developed by J. Welles Wilder Jr., creator of the relative strength index (RSI).1
On a chart, the indicator appears as a series of dots placed either above or below the price bars. A dot below the price is deemed to be a bullish signal. Conversely, a dot above the price is used to illustrate that the bears are in control and that the momentum is likely to remain downward. When the dots flip, it indicates that a potential change in price direction is under way. For example, if the dots are above the price, when they flip below the price, it could signal a further rise in price.
Additional Options
- Toggle signals on/off
- HiLo mode
- Kaufman adaptive, Ehlers adaptive, or non adaptive
- Filter by Pips
- Minimum Change by Pips
- Color bars
Enjoy!
릴리즈 노트
Updated pip cutoffs and filters릴리즈 노트
Updated to handle JPY and other assets on pip filters.오픈 소스 스크립트
트레이딩뷰의 진정한 정신에 따라, 이 스크립트의 작성자는 이를 오픈소스로 공개하여 트레이더들이 기능을 검토하고 검증할 수 있도록 했습니다. 작성자에게 찬사를 보냅니다! 이 코드는 무료로 사용할 수 있지만, 코드를 재게시하는 경우 하우스 룰이 적용된다는 점을 기억하세요.
Public Telegram Group, t.me/algxtrading_public
VIP Membership Info: patreon.com/algxtrading/membership
VIP Membership Info: patreon.com/algxtrading/membership
면책사항
해당 정보와 게시물은 금융, 투자, 트레이딩 또는 기타 유형의 조언이나 권장 사항으로 간주되지 않으며, 트레이딩뷰에서 제공하거나 보증하는 것이 아닙니다. 자세한 내용은 이용 약관을 참조하세요.
오픈 소스 스크립트
트레이딩뷰의 진정한 정신에 따라, 이 스크립트의 작성자는 이를 오픈소스로 공개하여 트레이더들이 기능을 검토하고 검증할 수 있도록 했습니다. 작성자에게 찬사를 보냅니다! 이 코드는 무료로 사용할 수 있지만, 코드를 재게시하는 경우 하우스 룰이 적용된다는 점을 기억하세요.
Public Telegram Group, t.me/algxtrading_public
VIP Membership Info: patreon.com/algxtrading/membership
VIP Membership Info: patreon.com/algxtrading/membership
면책사항
해당 정보와 게시물은 금융, 투자, 트레이딩 또는 기타 유형의 조언이나 권장 사항으로 간주되지 않으며, 트레이딩뷰에서 제공하거나 보증하는 것이 아닙니다. 자세한 내용은 이용 약관을 참조하세요.