OPEN-SOURCE SCRIPT
Bull/Bear Ratio By Month Table [MsF]
Japanese below / 日本語説明は英文の後にあります。
-------------------------
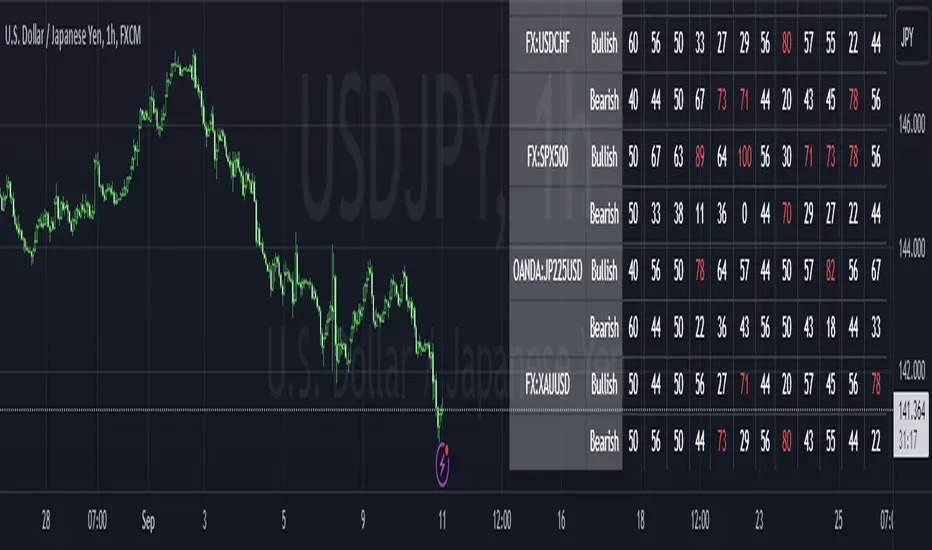
This is an indicator that shows monthly bull-bear ratio in a table.
By specifying the start year and end year, the ratio will be calculated and showed based on the number of bullish and bearish lines in the monthly bar. It allows you to analyze the trend of each symbol and month (bullish / bearish). Up to 10 symbols can be specified.
You can take monthly bull-bear ratio for the past 10 or 20 years on the web, but with this indicator, you can narrow it down to the period in which you want to see the symbols you want to see. It is very convenient because you can take statistics at will.
Furthermore, if the specified ratio is exceeded, the font color can be changed to any color, making it very easy to read.
=== Parameter description ===
- From … Year of start of aggregation
- To … Year of end of aggregation
- Row Background Color … Row title background color
- Col Background Color … Column title background color
- Base Text Color … Text color
- Background Color … Background Color
- Border Color … Border Color
- Location … Location
- Text Size … Text Size
- Highlight Threshold … Ratio threshold, and color
- Display in counter? … Check if you want to show the number of times instead of the ratio
-------------------------
月別陰陽確率をテーブル表示するインジケータです。
開始年から終了年を指定することで、月足における陽線数および陰線数を元に確率を計算して表示します。
この機能により各シンボルおよび各月の特徴(買われやすい/売られやすい)を認識することができアノマリー分析が可能です。
シンボルは10個まで指定可能です。
過去10年、20年の月別陰陽確率は、Web上でよく見かけますが、このインジケータでは見たいシンボルを見たい期間に絞って、
自由自在に統計を取ることができるため大変便利です。
なお、指定した確率を上回った場合、文字色を任意の色に変更することができるため、大変見やすくなっています。
=== パラメータの説明 ===
- From … 集計開始年
- To … 集計終了年
- Row Background Color … 行タイトルの背景色
- Col Background Color … 列タイトルの背景色
- Base Text Color … テキストカラー
- Background Color … 背景色
- Border Color … 区切り線の色
- Location … 配置
- Text Size … テキストサイズ
- Highlight Threshold … 色変更する確率の閾値、および色
- Display in counter? … 確率ではなく回数表示する場合はチェックする
-------------------------
This is an indicator that shows monthly bull-bear ratio in a table.
By specifying the start year and end year, the ratio will be calculated and showed based on the number of bullish and bearish lines in the monthly bar. It allows you to analyze the trend of each symbol and month (bullish / bearish). Up to 10 symbols can be specified.
You can take monthly bull-bear ratio for the past 10 or 20 years on the web, but with this indicator, you can narrow it down to the period in which you want to see the symbols you want to see. It is very convenient because you can take statistics at will.
Furthermore, if the specified ratio is exceeded, the font color can be changed to any color, making it very easy to read.
=== Parameter description ===
- From … Year of start of aggregation
- To … Year of end of aggregation
- Row Background Color … Row title background color
- Col Background Color … Column title background color
- Base Text Color … Text color
- Background Color … Background Color
- Border Color … Border Color
- Location … Location
- Text Size … Text Size
- Highlight Threshold … Ratio threshold, and color
- Display in counter? … Check if you want to show the number of times instead of the ratio
-------------------------
月別陰陽確率をテーブル表示するインジケータです。
開始年から終了年を指定することで、月足における陽線数および陰線数を元に確率を計算して表示します。
この機能により各シンボルおよび各月の特徴(買われやすい/売られやすい)を認識することができアノマリー分析が可能です。
シンボルは10個まで指定可能です。
過去10年、20年の月別陰陽確率は、Web上でよく見かけますが、このインジケータでは見たいシンボルを見たい期間に絞って、
自由自在に統計を取ることができるため大変便利です。
なお、指定した確率を上回った場合、文字色を任意の色に変更することができるため、大変見やすくなっています。
=== パラメータの説明 ===
- From … 集計開始年
- To … 集計終了年
- Row Background Color … 行タイトルの背景色
- Col Background Color … 列タイトルの背景色
- Base Text Color … テキストカラー
- Background Color … 背景色
- Border Color … 区切り線の色
- Location … 配置
- Text Size … テキストサイズ
- Highlight Threshold … 色変更する確率の閾値、および色
- Display in counter? … 確率ではなく回数表示する場合はチェックする
오픈 소스 스크립트
트레이딩뷰의 진정한 정신에 따라, 이 스크립트의 작성자는 이를 오픈소스로 공개하여 트레이더들이 기능을 검토하고 검증할 수 있도록 했습니다. 작성자에게 찬사를 보냅니다! 이 코드는 무료로 사용할 수 있지만, 코드를 재게시하는 경우 하우스 룰이 적용된다는 점을 기억하세요.
면책사항
해당 정보와 게시물은 금융, 투자, 트레이딩 또는 기타 유형의 조언이나 권장 사항으로 간주되지 않으며, 트레이딩뷰에서 제공하거나 보증하는 것이 아닙니다. 자세한 내용은 이용 약관을 참조하세요.
오픈 소스 스크립트
트레이딩뷰의 진정한 정신에 따라, 이 스크립트의 작성자는 이를 오픈소스로 공개하여 트레이더들이 기능을 검토하고 검증할 수 있도록 했습니다. 작성자에게 찬사를 보냅니다! 이 코드는 무료로 사용할 수 있지만, 코드를 재게시하는 경우 하우스 룰이 적용된다는 점을 기억하세요.
면책사항
해당 정보와 게시물은 금융, 투자, 트레이딩 또는 기타 유형의 조언이나 권장 사항으로 간주되지 않으며, 트레이딩뷰에서 제공하거나 보증하는 것이 아닙니다. 자세한 내용은 이용 약관을 참조하세요.