OPEN-SOURCE SCRIPT
업데이트됨 Strong Tight Closes in Strong Uptrend
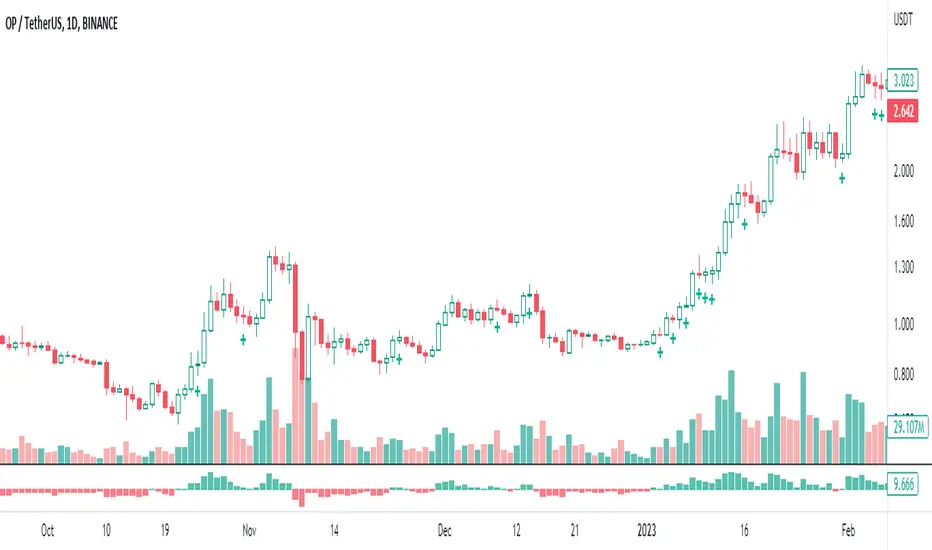
This indicator helps to visually identify "strong tight closes" in an uptrend. It serves to make it easier to spot not only tight but tight AND strong consolidations in an ongoing uptrend for a potential continuation entry. Please keep in mind the indicator counts with distance between Close values of 2 separate candles, that's why it's called "Tight Back to Back Candles". This doesn't identify "tight close" in a sense of very narrow range between Open and Close of a single candle, not any other volatility measures such as average true range etc.
Caution: This is not a complete strategy, it's only a visual tool for making potential continuation patterns easier to spot.
Conditions:
- Measure the difference between CLOSE values of two candles in percentages
- If the difference is lower than a certain threshold set by the user, (1.3% by default) plot a green cross below the latter candle
Filters:
- Low of both candles must be above 10EMA on the current timeframe
- Both Closes must be in the upper half of the candles' Low to High range
릴리즈 노트
Now AT LEAST one of the candles must close in the UPPER 60% of its Low to High range릴리즈 노트
- Default percentage threshold set to 2.0% as it suits better the higher timeframes such as Daily- Candle must CLOSE above 10EMA to pass the filter (previously it was set to LOW of the candle above 10EMA, that was more strict and didn't catch the beginning of trends when EMA is just curling up)
릴리즈 노트
User can define whether the condition for price above 10EMA is LOW, HIGH, OPEN or CLOSE오픈 소스 스크립트
트레이딩뷰의 진정한 정신에 따라, 이 스크립트의 작성자는 이를 오픈소스로 공개하여 트레이더들이 기능을 검토하고 검증할 수 있도록 했습니다. 작성자에게 찬사를 보냅니다! 이 코드는 무료로 사용할 수 있지만, 코드를 재게시하는 경우 하우스 룰이 적용된다는 점을 기억하세요.
면책사항
해당 정보와 게시물은 금융, 투자, 트레이딩 또는 기타 유형의 조언이나 권장 사항으로 간주되지 않으며, 트레이딩뷰에서 제공하거나 보증하는 것이 아닙니다. 자세한 내용은 이용 약관을 참조하세요.
오픈 소스 스크립트
트레이딩뷰의 진정한 정신에 따라, 이 스크립트의 작성자는 이를 오픈소스로 공개하여 트레이더들이 기능을 검토하고 검증할 수 있도록 했습니다. 작성자에게 찬사를 보냅니다! 이 코드는 무료로 사용할 수 있지만, 코드를 재게시하는 경우 하우스 룰이 적용된다는 점을 기억하세요.
면책사항
해당 정보와 게시물은 금융, 투자, 트레이딩 또는 기타 유형의 조언이나 권장 사항으로 간주되지 않으며, 트레이딩뷰에서 제공하거나 보증하는 것이 아닙니다. 자세한 내용은 이용 약관을 참조하세요.