OPEN-SOURCE SCRIPT
Straddle Indicator - Padding Guide
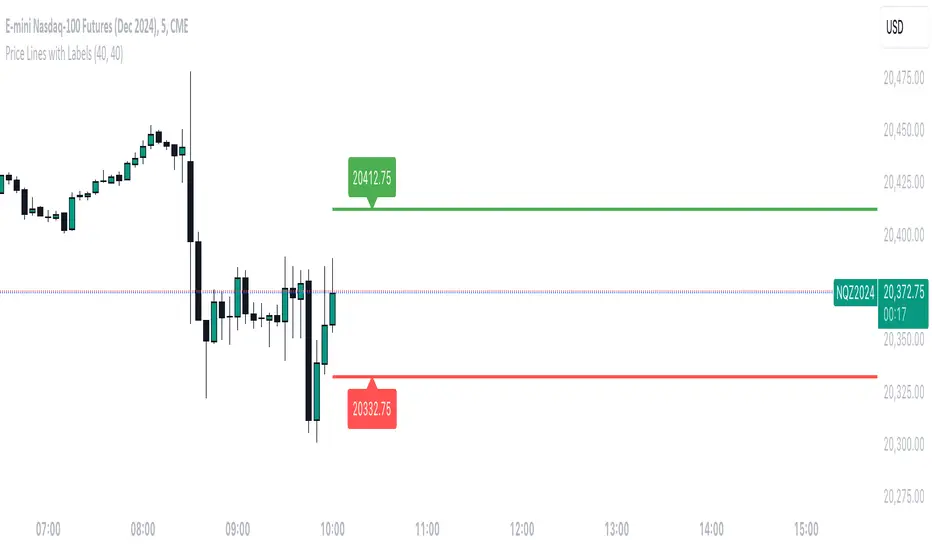
The Straddle Indicator is designed to help traders visualize potential market movements by straddling the current price. This indicator draws two horizontal lines on the chart: one positioned above and one below the current price, based on user-defined offsets.
Key Features:
Dynamic Price Levels: The levels are calculated based on the current closing price, allowing the indicator to adapt to changing market conditions in real time.
Customizable Offsets: Traders can customize the offsets for the lines above and below the current price, providing flexibility to align with their trading strategies or market analysis.
Visual Clarity: The indicator displays the price levels as horizontal lines in distinct colors (green for above and red for below) along with corresponding labels showing the exact price levels, facilitating quick reference.
Current Bar Focus: The lines and labels are updated to only reflect the current bar, minimizing chart clutter and making it easy to focus on the most relevant price action.
This indicator is particularly useful for traders employing straddle strategies, as it helps to anticipate potential price movements and plan entries or exits accordingly.
오픈 소스 스크립트
트레이딩뷰의 진정한 정신에 따라, 이 스크립트의 작성자는 이를 오픈소스로 공개하여 트레이더들이 기능을 검토하고 검증할 수 있도록 했습니다. 작성자에게 찬사를 보냅니다! 이 코드는 무료로 사용할 수 있지만, 코드를 재게시하는 경우 하우스 룰이 적용된다는 점을 기억하세요.
면책사항
해당 정보와 게시물은 금융, 투자, 트레이딩 또는 기타 유형의 조언이나 권장 사항으로 간주되지 않으며, 트레이딩뷰에서 제공하거나 보증하는 것이 아닙니다. 자세한 내용은 이용 약관을 참조하세요.
오픈 소스 스크립트
트레이딩뷰의 진정한 정신에 따라, 이 스크립트의 작성자는 이를 오픈소스로 공개하여 트레이더들이 기능을 검토하고 검증할 수 있도록 했습니다. 작성자에게 찬사를 보냅니다! 이 코드는 무료로 사용할 수 있지만, 코드를 재게시하는 경우 하우스 룰이 적용된다는 점을 기억하세요.
면책사항
해당 정보와 게시물은 금융, 투자, 트레이딩 또는 기타 유형의 조언이나 권장 사항으로 간주되지 않으며, 트레이딩뷰에서 제공하거나 보증하는 것이 아닙니다. 자세한 내용은 이용 약관을 참조하세요.