OPEN-SOURCE SCRIPT
업데이트됨 Pattern Finder & Forecast
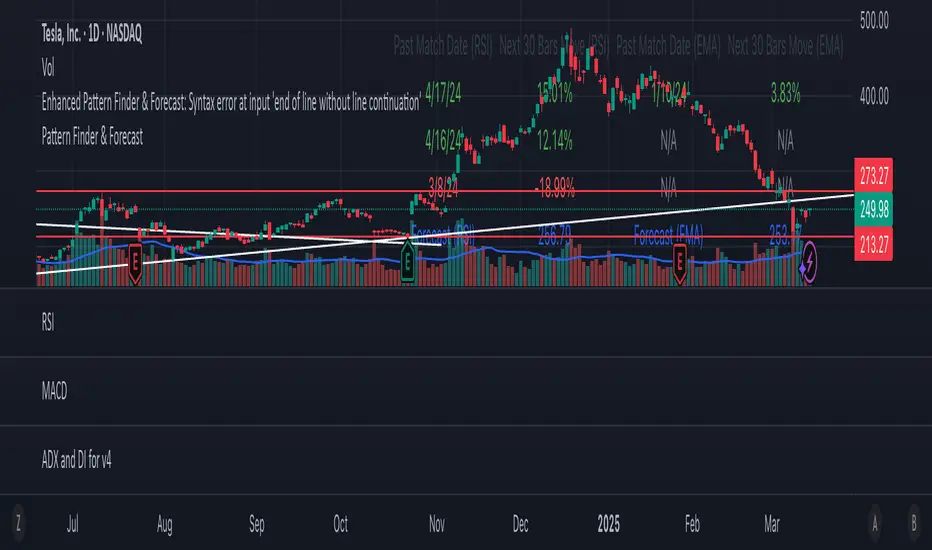
This script is a pattern-finding and forecasting tool that analyzes historical price data based on EMA (Exponential Moving Averages) and RSI (Relative Strength Index). It identifies past occurrences where the last 30 bars of data resemble the most recent 30 bars and predicts the future price movement based on those past patterns.
릴리즈 노트
This Pine Script analyzes past stock price movements using RSI (Relative Strength Index) and EMA (Exponential Moving Averages - 20, 50, 200 periods) to identify historical patterns and predict potential future price movements.Key Features:
Pattern Detection:
Compares the current RSI and EMA distances from the price with historical data.
Searches for up to 3 similar patterns from the past within a lookback period (default: 5000 bars).
Similarity Check:
Uses a similarity threshold to determine close matches.
Measures difference in RSI and EMA values to find past occurrences.
Forecasting Future Moves:
Once similar past patterns are found, the script calculates the average price movement over the next 30 bars based on those past occurrences.
Predicts the potential future price movement using the average of these historical moves.
Table Display:
Shows past match dates (formatted correctly as MM/DD/YY).
Displays the expected price change (%) for RSI and EMA-based matches.
Highlights forecasted price movement for the next 30 bars.
How It Works:
The script scans historical data to find similar RSI and EMA patterns.
If matches are found, it records the next 30-bar price movement for those past occurrences.
It then calculates an average forecasted move based on past behavior.
The results are displayed in a table with historical matches and forecasted price changes.
This helps traders analyze whether the current market condition resembles past trends and estimate potential price direction
오픈 소스 스크립트
트레이딩뷰의 진정한 정신에 따라, 이 스크립트의 작성자는 이를 오픈소스로 공개하여 트레이더들이 기능을 검토하고 검증할 수 있도록 했습니다. 작성자에게 찬사를 보냅니다! 이 코드는 무료로 사용할 수 있지만, 코드를 재게시하는 경우 하우스 룰이 적용된다는 점을 기억하세요.
면책사항
해당 정보와 게시물은 금융, 투자, 트레이딩 또는 기타 유형의 조언이나 권장 사항으로 간주되지 않으며, 트레이딩뷰에서 제공하거나 보증하는 것이 아닙니다. 자세한 내용은 이용 약관을 참조하세요.
오픈 소스 스크립트
트레이딩뷰의 진정한 정신에 따라, 이 스크립트의 작성자는 이를 오픈소스로 공개하여 트레이더들이 기능을 검토하고 검증할 수 있도록 했습니다. 작성자에게 찬사를 보냅니다! 이 코드는 무료로 사용할 수 있지만, 코드를 재게시하는 경우 하우스 룰이 적용된다는 점을 기억하세요.
면책사항
해당 정보와 게시물은 금융, 투자, 트레이딩 또는 기타 유형의 조언이나 권장 사항으로 간주되지 않으며, 트레이딩뷰에서 제공하거나 보증하는 것이 아닙니다. 자세한 내용은 이용 약관을 참조하세요.