OPEN-SOURCE SCRIPT
Accumulation/Distribution
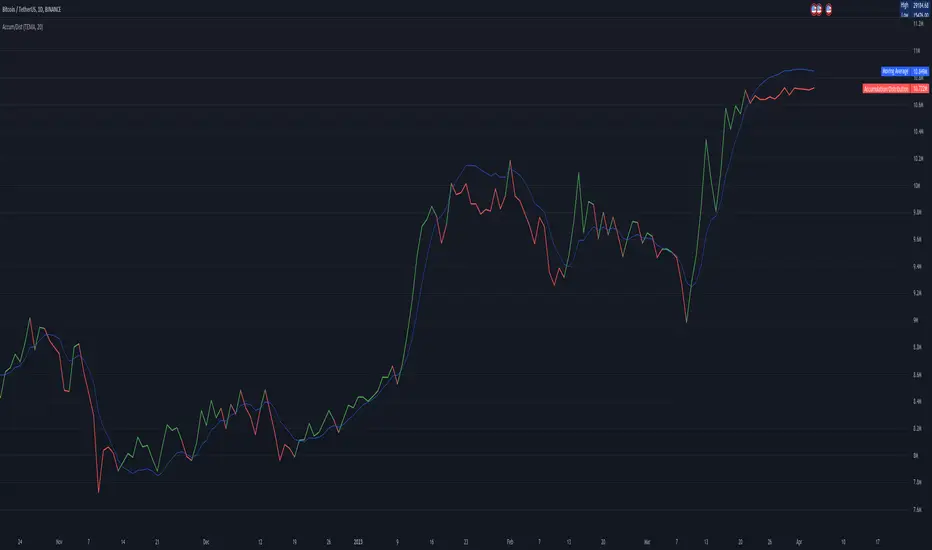
Accumulation/Distribution explains when the big players buy or sell, according to Wyckoff.
I added some colors to make it more visibly, to get a hint when (not) to invest.
A/D is a lagging indicator.
When the MA is above A/D line, this should reflect distribution time, and big players are selling.
The oppsite is when MA is below the A/D line, then this should be an accumulation phase, and big players are buying.
For example, my preference is a TEMA20 for crypto, this gives me good results.
But I added a bunch of moving averages to choose from.
Depending on preferences/marked you can choose a moving average, set its length, and you can choose all the colors too.
I recommend the Volume indicator to setup the MA line, and this will get much better results!

I hope this script will help some people to do some better decisions.
And I am pleased to get some advice to make this script even better!
There is only one similar-sounding script in the public section.
Kudos go to jbneto with his Accum/ Dist + 200 EMA which gave me the inspiration.
It has a EMA200, and its focus is on the daily pivot price.
I added some colors to make it more visibly, to get a hint when (not) to invest.
A/D is a lagging indicator.
When the MA is above A/D line, this should reflect distribution time, and big players are selling.
The oppsite is when MA is below the A/D line, then this should be an accumulation phase, and big players are buying.
For example, my preference is a TEMA20 for crypto, this gives me good results.
But I added a bunch of moving averages to choose from.
Depending on preferences/marked you can choose a moving average, set its length, and you can choose all the colors too.
I recommend the Volume indicator to setup the MA line, and this will get much better results!
I hope this script will help some people to do some better decisions.
And I am pleased to get some advice to make this script even better!
There is only one similar-sounding script in the public section.
Kudos go to jbneto with his Accum/ Dist + 200 EMA which gave me the inspiration.
It has a EMA200, and its focus is on the daily pivot price.
오픈 소스 스크립트
트레이딩뷰의 진정한 정신에 따라, 이 스크립트의 작성자는 이를 오픈소스로 공개하여 트레이더들이 기능을 검토하고 검증할 수 있도록 했습니다. 작성자에게 찬사를 보냅니다! 이 코드는 무료로 사용할 수 있지만, 코드를 재게시하는 경우 하우스 룰이 적용된다는 점을 기억하세요.
면책사항
해당 정보와 게시물은 금융, 투자, 트레이딩 또는 기타 유형의 조언이나 권장 사항으로 간주되지 않으며, 트레이딩뷰에서 제공하거나 보증하는 것이 아닙니다. 자세한 내용은 이용 약관을 참조하세요.
오픈 소스 스크립트
트레이딩뷰의 진정한 정신에 따라, 이 스크립트의 작성자는 이를 오픈소스로 공개하여 트레이더들이 기능을 검토하고 검증할 수 있도록 했습니다. 작성자에게 찬사를 보냅니다! 이 코드는 무료로 사용할 수 있지만, 코드를 재게시하는 경우 하우스 룰이 적용된다는 점을 기억하세요.
면책사항
해당 정보와 게시물은 금융, 투자, 트레이딩 또는 기타 유형의 조언이나 권장 사항으로 간주되지 않으며, 트레이딩뷰에서 제공하거나 보증하는 것이 아닙니다. 자세한 내용은 이용 약관을 참조하세요.