OPEN-SOURCE SCRIPT
Delivery Volume Indicator
Delivery Volume Indicator
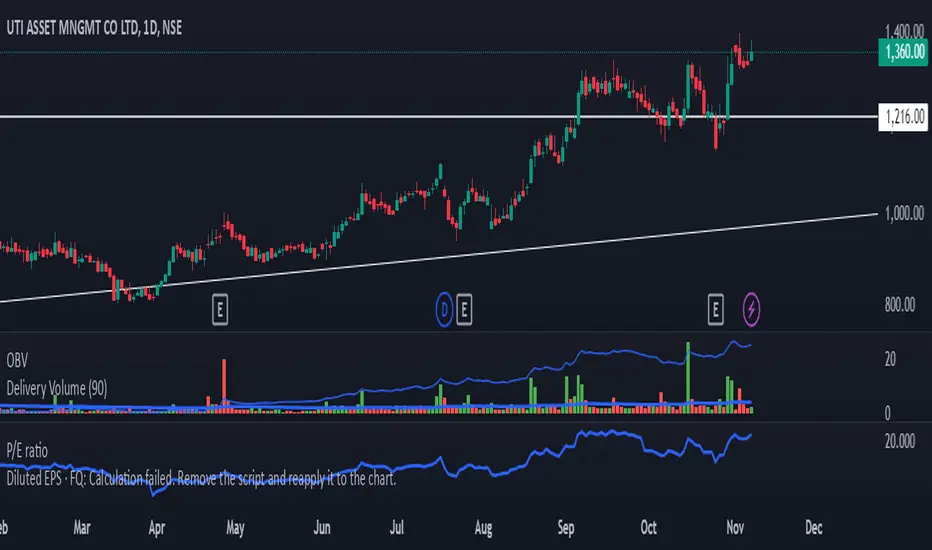
The Delivery Volume Indicator is designed to provide insights into trading volume specifically delivered on a daily basis, scaled in lakhs (hundreds of thousands) for ease of interpretation. This tool can be especially useful for traders looking to monitor delivery-based volume changes and trends, as it helps to distinguish between bullish and bearish volume flows.
Key Features:
Daily Volume in Lakhs: The indicator pulls daily volume data and scales it to lakhs for more readable values.
Bullish/Bearish Color Coding: The indicator color-codes volume columns to reflect market sentiment. Columns are displayed in green when the price closes higher than it opens (bullish) and in red when the price closes lower than it opens (bearish).
Adjustable EMA: A customizable Exponential Moving Average (EMA) is applied to the scaled delivery volume. The EMA line, displayed in blue, helps smooth out volume trends and allows traders to adjust the period for personal strategy alignment.
How to Use:
Observe the delivery volume changes to track market sentiment over time. Increased bullish delivery volume could indicate accumulating interest, while increased bearish delivery volume might suggest distribution.
Utilize the EMA to identify longer-term trends in delivery volume, with shorter EMA periods for quick volume shifts and longer periods for gradual trend changes.
This indicator is ideal for traders seeking volume-based insights that align closely with price action.
오픈 소스 스크립트
트레이딩뷰의 진정한 정신에 따라, 이 스크립트의 작성자는 이를 오픈소스로 공개하여 트레이더들이 기능을 검토하고 검증할 수 있도록 했습니다. 작성자에게 찬사를 보냅니다! 이 코드는 무료로 사용할 수 있지만, 코드를 재게시하는 경우 하우스 룰이 적용된다는 점을 기억하세요.
면책사항
해당 정보와 게시물은 금융, 투자, 트레이딩 또는 기타 유형의 조언이나 권장 사항으로 간주되지 않으며, 트레이딩뷰에서 제공하거나 보증하는 것이 아닙니다. 자세한 내용은 이용 약관을 참조하세요.
오픈 소스 스크립트
트레이딩뷰의 진정한 정신에 따라, 이 스크립트의 작성자는 이를 오픈소스로 공개하여 트레이더들이 기능을 검토하고 검증할 수 있도록 했습니다. 작성자에게 찬사를 보냅니다! 이 코드는 무료로 사용할 수 있지만, 코드를 재게시하는 경우 하우스 룰이 적용된다는 점을 기억하세요.
면책사항
해당 정보와 게시물은 금융, 투자, 트레이딩 또는 기타 유형의 조언이나 권장 사항으로 간주되지 않으며, 트레이딩뷰에서 제공하거나 보증하는 것이 아닙니다. 자세한 내용은 이용 약관을 참조하세요.