OPEN-SOURCE SCRIPT
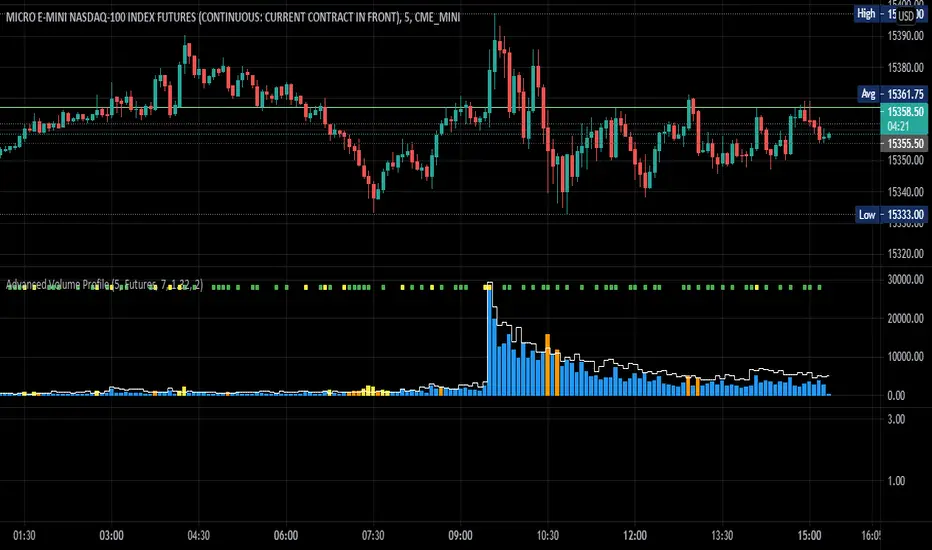
Advanced Volume Profile
THIS SCRIPT CURRENTLY ONLY WORKS FOR ASSETS THAT TRADE 24/7 OR CBOE FUTURES HOURS!
This script plots volume relative to an asset's historical volume profile.
Usage:
As a companion to my "Unusual Time Frame Volume" (UTF Volume) script, this plots volume against the same historical volume profile used for UTF Volume.
The same high volume (relative to historical) threshold alert is available (yellow bar).
Likewise, if the volume exceeds the historical threshold, but is below the alert threshold, the bar color is orange.
At the top of the chart is an indicator which is green if a bar has higher volume than the previous bar.
You can also set a threshold for this such that if the volume of a bar exceeds the previous bar by a certain multiplier which will turn the indicator yellow.
For example, if the threshold is set to "1.5", then the indicator will be yellow (instead of green) on an increase in volume over the previous bar of 1.5x.
NOTES:
Again, this script currently only works for assets that trade 24/7 or CBOE Futures hours!
Make sure you set the "Asset Mode" and "Time Frame (minutes)" to values that match your asset and chart setting.
For example, if you are trading Futures on a 2m chart, set the Asset Mode to Futures and Time Frame to 2m.
If you are trading crypto on a 5m chart, set the Asset Mode to 24/7 and Time Frame to 5m.
If the settings are not set appropriately, the output will be incorrect/invalid.
If you choose a "Look-back (Days)" setting that is too far back given the time frame, the script will produce an error.
I suggest playing with settings from "1" (compares volume to the previous day's volume) to the highest number that doesn't break the script.
For example, at a 2m time frame, the maximum look-back will be "6" or "7" depending on which mode you are using.
Longer chart time settings allow larger look-back values.
I find that the default value ("6") does a decent job in general.
Please feel free to reuse or further develop this script.
I would greatly appreciate it if you would send me a message below if you find it useful.
오픈 소스 스크립트
트레이딩뷰의 진정한 정신에 따라, 이 스크립트의 작성자는 이를 오픈소스로 공개하여 트레이더들이 기능을 검토하고 검증할 수 있도록 했습니다. 작성자에게 찬사를 보냅니다! 이 코드는 무료로 사용할 수 있지만, 코드를 재게시하는 경우 하우스 룰이 적용된다는 점을 기억하세요.
면책사항
해당 정보와 게시물은 금융, 투자, 트레이딩 또는 기타 유형의 조언이나 권장 사항으로 간주되지 않으며, 트레이딩뷰에서 제공하거나 보증하는 것이 아닙니다. 자세한 내용은 이용 약관을 참조하세요.
오픈 소스 스크립트
트레이딩뷰의 진정한 정신에 따라, 이 스크립트의 작성자는 이를 오픈소스로 공개하여 트레이더들이 기능을 검토하고 검증할 수 있도록 했습니다. 작성자에게 찬사를 보냅니다! 이 코드는 무료로 사용할 수 있지만, 코드를 재게시하는 경우 하우스 룰이 적용된다는 점을 기억하세요.
면책사항
해당 정보와 게시물은 금융, 투자, 트레이딩 또는 기타 유형의 조언이나 권장 사항으로 간주되지 않으며, 트레이딩뷰에서 제공하거나 보증하는 것이 아닙니다. 자세한 내용은 이용 약관을 참조하세요.