OPEN-SOURCE SCRIPT
Percentile Calculation @xcod33

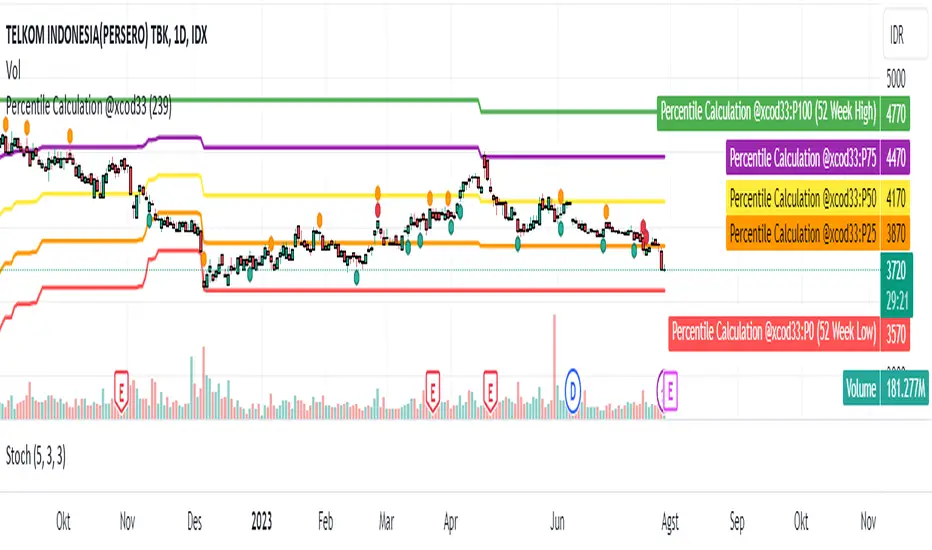
This script calculates the current price percentile based on the highest and lowest price range in the last 52 weeks.
How to Use:
This script will provide the current price percentile relative to the 52-week price range on your chart. You can use it as an indicator to help identify where the current price stands relative to the historical price range in that period.
Targeted Market:
This script can be applied to various financial markets, including stocks, forex, indices, commodities, and others. It is not limited to a specific market and can be used across various trading instruments.
Market Conditions:
Here are some market conditions where this script can be useful:
1. Identifying Price Extremes: By looking at the current percentile, you can see if the price is near the highest or lowest extremes in the last 52 weeks. If the percentile is close to 0%, it means the price is near the lowest, while a percentile close to 100% indicates the price is near the highest.
Finding Consolidation Patterns: You can identify whether the price is within a certain range by looking at the percentile. If the percentile is around 50%, it indicates a relatively consistent price range.
2. Identifying Breakouts and Pullbacks: When the price is outside the historical range and the percentile approaches 100%, it indicates a breakout. When the price retraces back to the range and the percentile approaches 50%, it indicates a pullback.
3. However, keep in mind that this indicator only provides an additional perspective on the price relative to the 52-week range. It is not recommended to use this indicator as the sole basis for trading decisions. Always use further analysis and other indicators to confirm your trading signals.
Credit :
- M Rico Aditya Prayoga | Author
- Tri Okta Setiawan Marblo | Maker of formulas and ideas
오픈 소스 스크립트
트레이딩뷰의 진정한 정신에 따라, 이 스크립트의 작성자는 이를 오픈소스로 공개하여 트레이더들이 기능을 검토하고 검증할 수 있도록 했습니다. 작성자에게 찬사를 보냅니다! 이 코드는 무료로 사용할 수 있지만, 코드를 재게시하는 경우 하우스 룰이 적용된다는 점을 기억하세요.
면책사항
해당 정보와 게시물은 금융, 투자, 트레이딩 또는 기타 유형의 조언이나 권장 사항으로 간주되지 않으며, 트레이딩뷰에서 제공하거나 보증하는 것이 아닙니다. 자세한 내용은 이용 약관을 참조하세요.
오픈 소스 스크립트
트레이딩뷰의 진정한 정신에 따라, 이 스크립트의 작성자는 이를 오픈소스로 공개하여 트레이더들이 기능을 검토하고 검증할 수 있도록 했습니다. 작성자에게 찬사를 보냅니다! 이 코드는 무료로 사용할 수 있지만, 코드를 재게시하는 경우 하우스 룰이 적용된다는 점을 기억하세요.
면책사항
해당 정보와 게시물은 금융, 투자, 트레이딩 또는 기타 유형의 조언이나 권장 사항으로 간주되지 않으며, 트레이딩뷰에서 제공하거나 보증하는 것이 아닙니다. 자세한 내용은 이용 약관을 참조하세요.