OPEN-SOURCE SCRIPT
Richs Market Structure
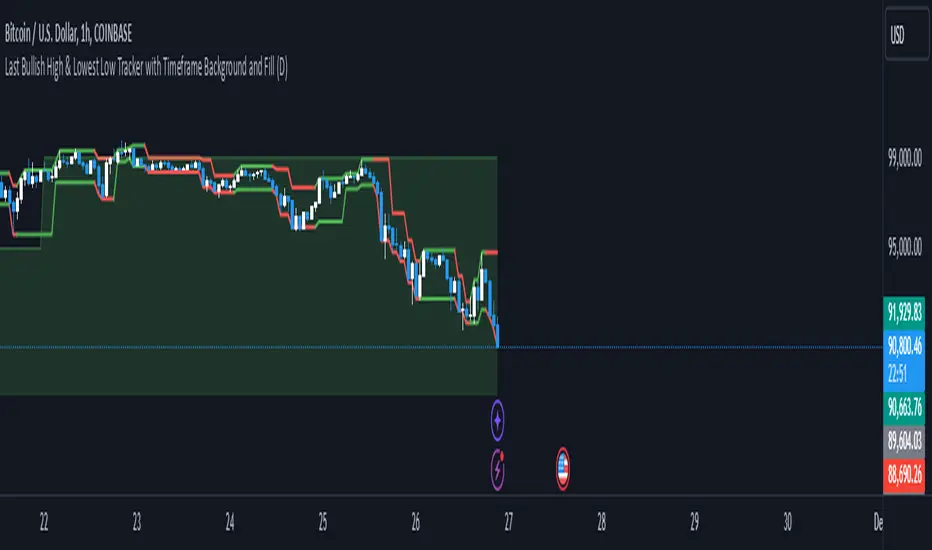
This Pine Script indicator, "Last Bullish High & Lowest Low Tracker with Timeframe Background and Fill", is designed to visually track bullish and bearish trends based on price action on the current chart and a user-defined timeframe. It provides dynamic line plotting, area fills, and background coloring to represent trend alignment between the current chart and the selected timeframe.
Features and Functionalities
Tracks Bullish Highs and Bearish Lows:
The script identifies:
Bullish High: The highest price reached after a bullish (green) candle.
Bearish Low: The lowest price reached after a bearish (red) candle.
It dynamically updates these levels based on the price movements.
Line Plotting:
Current Chart Lines:
The Plotted Bullish High line (green/red) indicates the last bullish high.
The Lowest Low line (green/red) indicates the last bearish low.
Selected Timeframe Lines:
A separate set of lines is plotted for the user-defined timeframe (e.g., daily, weekly):
A Bullish High Line for the selected timeframe (lighter green).
A Lowest Low Line for the selected timeframe (lighter red).
Dynamic Area Fills:
The area between the Plotted Bullish High and Lowest Low is filled:
Green Fill: When both lines are green (indicating a bullish alignment).
Red Fill: When both lines are red (indicating a bearish alignment).
For the selected timeframe:
The area between the timeframe-specific Bullish High and Lowest Low is similarly filled with lighter colors.
Background Color Based on Timeframe Alignment:
The background color represents the trend alignment on the selected timeframe:
Green Background: When the timeframe’s Bullish High is rising and Lowest Low is rising (bullish trend).
Red Background: When the timeframe’s Bullish High is falling and Lowest Low is falling (bearish trend).
What It’s For
This indicator is designed for traders who want to:
Visualize Trends Across Timeframes:
It helps identify when the current chart’s trend aligns with a higher timeframe trend (e.g., daily, weekly).
Useful for multi-timeframe analysis.
Spot Bullish and Bearish Trends:
The color-coded lines and fills clearly show the dominant trend on both the current chart and the selected timeframe.
Plan Trades Based on Trend Alignment:
When the current chart and selected timeframe show the same trend:
Both lines and fills turn green (bullish).
Both lines and fills turn red (bearish).
This alignment is a potential signal for entering long or short trades.
Identify Reversals and Divergences:
Divergence between the current chart and timeframe trends (e.g., green on one, red on the other) may indicate trend weakening or reversal.
Visual Elements
Lines:
Solid lines (current chart): Represent the Plotted Bullish High and Lowest Low.
Dashed/lighter lines (selected timeframe): Represent the timeframe-specific Bullish High and Lowest Low.
Fills:
Green/Red fills highlight trend zones:
On the current chart (darker).
On the selected timeframe (lighter).
Background:
The entire chart background turns green or red based on the selected timeframe’s trend alignment.
Summary
This indicator is ideal for traders who want a clear visual representation of price trends and multi-timeframe alignment. It simplifies trend-following strategies by providing:
Easy-to-interpret fills and background colors.
Clear bullish and bearish zones.
Multi-timeframe trend confirmation.
오픈 소스 스크립트
트레이딩뷰의 진정한 정신에 따라, 이 스크립트의 작성자는 이를 오픈소스로 공개하여 트레이더들이 기능을 검토하고 검증할 수 있도록 했습니다. 작성자에게 찬사를 보냅니다! 이 코드는 무료로 사용할 수 있지만, 코드를 재게시하는 경우 하우스 룰이 적용된다는 점을 기억하세요.
면책사항
해당 정보와 게시물은 금융, 투자, 트레이딩 또는 기타 유형의 조언이나 권장 사항으로 간주되지 않으며, 트레이딩뷰에서 제공하거나 보증하는 것이 아닙니다. 자세한 내용은 이용 약관을 참조하세요.
오픈 소스 스크립트
트레이딩뷰의 진정한 정신에 따라, 이 스크립트의 작성자는 이를 오픈소스로 공개하여 트레이더들이 기능을 검토하고 검증할 수 있도록 했습니다. 작성자에게 찬사를 보냅니다! 이 코드는 무료로 사용할 수 있지만, 코드를 재게시하는 경우 하우스 룰이 적용된다는 점을 기억하세요.
면책사항
해당 정보와 게시물은 금융, 투자, 트레이딩 또는 기타 유형의 조언이나 권장 사항으로 간주되지 않으며, 트레이딩뷰에서 제공하거나 보증하는 것이 아닙니다. 자세한 내용은 이용 약관을 참조하세요.