PROTECTED SOURCE SCRIPT
MACD MTF
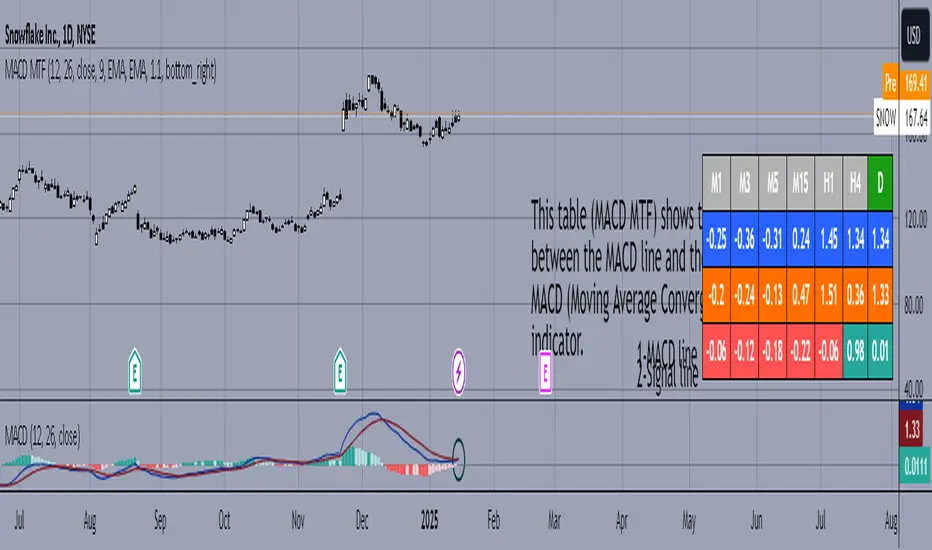
This table is a technical indicator that shows the proximity between the MACD line and the signal line of the multitemporal MACD (Moving Average Convergence Divergence) indicator. When the crossover is bullish, the timeframe will light up in green, and vice versa, if the crossover is bearish, the timeframe will light up in red. With this table, we can save time when detecting opportunities, as with one glance, we can spot potential MACD crossovers (which tend to indicate price action inflection points).
Esta tabla es un indicador técnico que muestra la proximidad entre la línea MACD y la línea de señal del indicador MACD (Moving Average Convergence Divergence) multitemporalmente. Cuando el cruce es alcista la temporalidad se iluminará en verde, y viceversa, si el cruce es bajista la temporalidad se iluminará en rojo. Con esta tabla podremos ahorrar tiempo a la hora de detectar oportunidades, pues de un vistazo podremos detectar posibles cruces de MACD (tienden a señalar puntos de inflexión en la acción de precio)
Esta tabla es un indicador técnico que muestra la proximidad entre la línea MACD y la línea de señal del indicador MACD (Moving Average Convergence Divergence) multitemporalmente. Cuando el cruce es alcista la temporalidad se iluminará en verde, y viceversa, si el cruce es bajista la temporalidad se iluminará en rojo. Con esta tabla podremos ahorrar tiempo a la hora de detectar oportunidades, pues de un vistazo podremos detectar posibles cruces de MACD (tienden a señalar puntos de inflexión en la acción de precio)
보호된 스크립트입니다
이 스크립트는 비공개 소스로 게시됩니다. 하지만 이를 자유롭게 제한 없이 사용할 수 있습니다 – 자세한 내용은 여기에서 확인하세요.
📖Revista El Especulador:
drive.google.com/file/d/1Fs8l9xSpZIy5haCb5l0HWzgeAanOifs_/view?usp=drivesdk
👉t.me/ElEspeculador96 (Telegram)
drive.google.com/file/d/1Fs8l9xSpZIy5haCb5l0HWzgeAanOifs_/view?usp=drivesdk
👉t.me/ElEspeculador96 (Telegram)
면책사항
해당 정보와 게시물은 금융, 투자, 트레이딩 또는 기타 유형의 조언이나 권장 사항으로 간주되지 않으며, 트레이딩뷰에서 제공하거나 보증하는 것이 아닙니다. 자세한 내용은 이용 약관을 참조하세요.