INVITE-ONLY SCRIPT
업데이트됨 MarketSniffer B
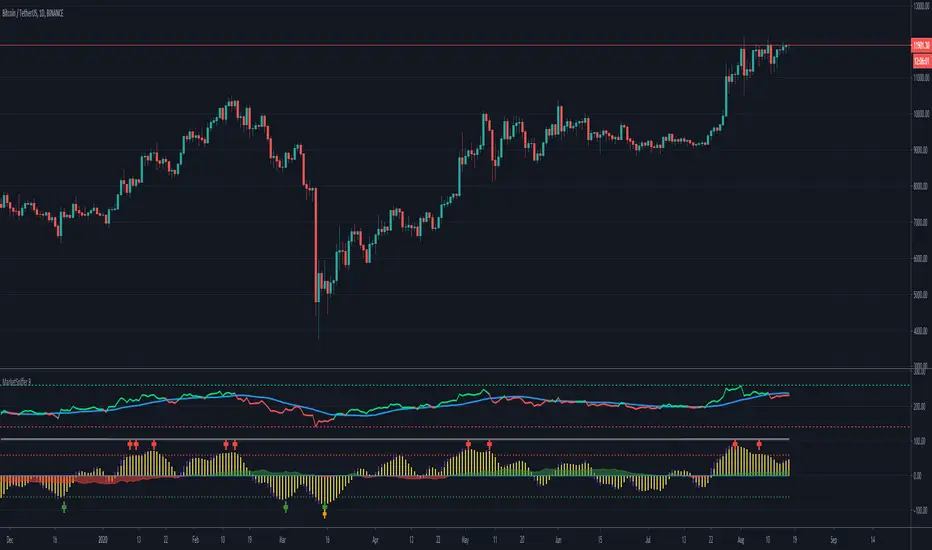
MarketSniffer B is a custom made indicator made by 2 friends that combined 2 strategies to make 1 indicator. It can detect good moments to buy and sell based on our strategy.
The indicator gives the same signals als marketsniffer A but has a diffrent way of showing it by using a histogram to make the momentum more clear when a buy / sell signal will be printed.
Marketsniffer B can be used in any market since its for a big part based on momentum. Although we recommend using it in the crypto market since it was tested and mainly made for crypto.
How to use it: MarketSniffer B can be used in many ways, own strategies can be made.
Example strategy: Lower timeframes (anything below the 1d) if the price is trading above the yellow 200 EMA, take the buy signals. If its trading below the 200 ema and you see a sell signal then sell / short
Example strategy: Higher timeframes (anything above the 1d) Any timeframe above the 1d, the 200 ema rule doesn't exist. Any buy signals should be good for taking a spot position. The sell signals therfore are NOT short signals but sell signals. Its just points to take profit from the buy signal.
Example strategy: Divergences and trendlines can be drawn on the waves as strategy. This indicator also had a RSI with EMA that can be used for this.
Its recommended to use the small timeframe signals (anything below 1d) for leverage trading. Any signals above 1day timeframe should be spot trading.
This indicator should be used in combination with MarketSniffer A
Use the link on our profile to get acces to this indicator.
릴리즈 노트
Added more alerts and added the alert message초대 전용 스크립트
이 스크립트는 작성자가 승인한 사용자만 접근할 수 있습니다. 사용하려면 요청 후 승인을 받아야 하며, 일반적으로 결제 후에 허가가 부여됩니다. 자세한 내용은 아래 작성자의 안내를 따르거나 Market-Sniffer에게 직접 문의하세요.
트레이딩뷰는 스크립트의 작동 방식을 충분히 이해하고 작성자를 완전히 신뢰하지 않는 이상, 해당 스크립트에 비용을 지불하거나 사용하는 것을 권장하지 않습니다. 커뮤니티 스크립트에서 무료 오픈소스 대안을 찾아보실 수도 있습니다.
작성자 지시 사항
면책사항
해당 정보와 게시물은 금융, 투자, 트레이딩 또는 기타 유형의 조언이나 권장 사항으로 간주되지 않으며, 트레이딩뷰에서 제공하거나 보증하는 것이 아닙니다. 자세한 내용은 이용 약관을 참조하세요.
초대 전용 스크립트
이 스크립트는 작성자가 승인한 사용자만 접근할 수 있습니다. 사용하려면 요청 후 승인을 받아야 하며, 일반적으로 결제 후에 허가가 부여됩니다. 자세한 내용은 아래 작성자의 안내를 따르거나 Market-Sniffer에게 직접 문의하세요.
트레이딩뷰는 스크립트의 작동 방식을 충분히 이해하고 작성자를 완전히 신뢰하지 않는 이상, 해당 스크립트에 비용을 지불하거나 사용하는 것을 권장하지 않습니다. 커뮤니티 스크립트에서 무료 오픈소스 대안을 찾아보실 수도 있습니다.
작성자 지시 사항
면책사항
해당 정보와 게시물은 금융, 투자, 트레이딩 또는 기타 유형의 조언이나 권장 사항으로 간주되지 않으며, 트레이딩뷰에서 제공하거나 보증하는 것이 아닙니다. 자세한 내용은 이용 약관을 참조하세요.