OPEN-SOURCE SCRIPT
Glitch Index
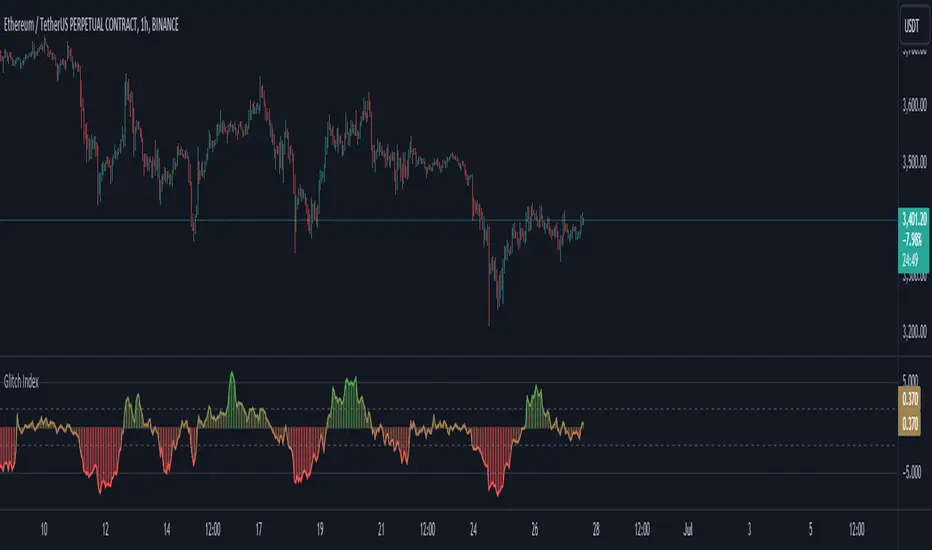
Glitch Index is an oscillator from an unknown origin that is discovered in 2013 as a lua indicator taken from MetaStock days and we are not really sure how far back the original idea goes.
How it Works?
As I found this indicator and looking at it's code in different platform I can see it comes back from a basic idea of getting a price value, calculating it's smoothed average with a set multiplier and getting the difference then presenting it on a simplified scale. It appears to be another interpretation of figuring out price acceleration and velocity. The main logic is calculated as below:
Pine Script®
How to Use?
Glitch Index can be used based on different implementations and along with your already existing trading system as a confirmation. Yoıu can use it as a Long signal when the histogram crosses inner levels or you can use it as an overbough and oversold signals when the histogram crosses above outter levels and gets back in the range between outter and inner levels.
You can customise the settings and set your prefered inner and outter levels in indicator settings along with gradient or static based coloring and modify the code as you see fit. The coloring code is set below:
Pine Script®
How it Works?
As I found this indicator and looking at it's code in different platform I can see it comes back from a basic idea of getting a price value, calculating it's smoothed average with a set multiplier and getting the difference then presenting it on a simplified scale. It appears to be another interpretation of figuring out price acceleration and velocity. The main logic is calculated as below:
price = priceSet(priceType)
_ma = getAverageName(price, MaMethod, MaPeriod)
rocma = ((_ma - _ma[1]) * 0.1) + 1
maMul = _ma * rocma
diff = price - maMul
gli_ind = (diff / price) * -10
How to Use?
Glitch Index can be used based on different implementations and along with your already existing trading system as a confirmation. Yoıu can use it as a Long signal when the histogram crosses inner levels or you can use it as an overbough and oversold signals when the histogram crosses above outter levels and gets back in the range between outter and inner levels.
You can customise the settings and set your prefered inner and outter levels in indicator settings along with gradient or static based coloring and modify the code as you see fit. The coloring code is set below:
gli_col = gli_ind > outterLevel ? color.green : gli_ind < -outterLevel ? color.red : gli_ind > innerLevel ? color.rgb(106, 185, 109, 57) : gli_ind < -innerLevel ? color.rgb(233, 111, 111, 40) : color.new(color.yellow, 60)
gradcol = color.from_gradient(gli_ind, -outterLevel, outterLevel, color.red, color.green)
colorSelect = colorType == "Gradient" ? gradcol : gli_col
오픈 소스 스크립트
트레이딩뷰의 진정한 정신에 따라, 이 스크립트의 작성자는 이를 오픈소스로 공개하여 트레이더들이 기능을 검토하고 검증할 수 있도록 했습니다. 작성자에게 찬사를 보냅니다! 이 코드는 무료로 사용할 수 있지만, 코드를 재게시하는 경우 하우스 룰이 적용된다는 점을 기억하세요.
One does not simply win every trade.
면책사항
해당 정보와 게시물은 금융, 투자, 트레이딩 또는 기타 유형의 조언이나 권장 사항으로 간주되지 않으며, 트레이딩뷰에서 제공하거나 보증하는 것이 아닙니다. 자세한 내용은 이용 약관을 참조하세요.