OPEN-SOURCE SCRIPT
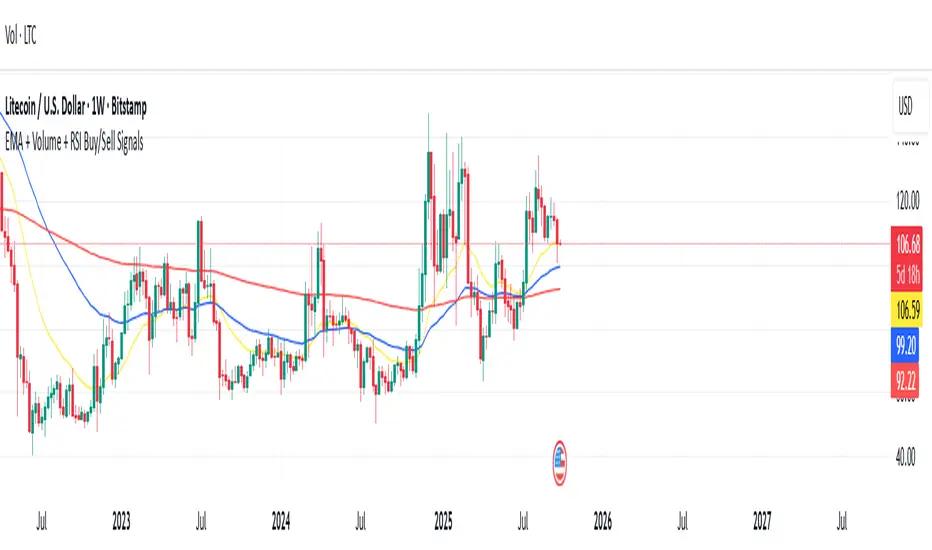
EMA + Volume + RSI Buy/Sell Signals
//version=5
indicator("EMA + Volume + RSI Buy/Sell Signals", overlay=true)
// === Inputs ===
ema20 = ta.ema(close, 20)
ema50 = ta.ema(close, 50)
ema200 = ta.ema(close, 200)
rsi = ta.rsi(close, 14)
// === Conditions ===
// Price % change from yesterday
priceChange = (close - close[1]) / close[1] * 100
// Volume condition
volCondition = volume > 1.5 * volume[1]
// RSI
rsiOverbought = rsi > 70
rsiOversold = rsi < 30
// Price move conditions
priceUp5 = priceChange > 5
priceDown5 = priceChange < -5
// === Buy & Sell Conditions ===
buySignal = close > ema20 and close > ema50 and close > ema200 and priceUp5 and volCondition and rsiOversold
sellSignal = close < ema20 and close < ema50 and close < ema200 and priceDown5 and volCondition and rsiOverbought
// === Plot EMAs ===
plot(ema20, color=color.yellow, title="EMA 20")
plot(ema50, color=color.blue, title="EMA 50")
plot(ema200, color=color.red, title="EMA 200")
// === Plot Signals on Chart ===
plotshape(buySignal, title="BUY Signal", style=shape.labelup, color=color.green, text="BUY", location=location.belowbar, size=size.normal)
plotshape(sellSignal, title="SELL Signal", style=shape.labeldown, color=color.red, text="SELL", location=location.abovebar, size=size.normal)
// === Background Highlight for Visuals ===
bgcolor(buySignal ? color.new(color.green, 85) : na)
bgcolor(sellSignal ? color.new(color.red, 85) : na)
오픈 소스 스크립트
진정한 트레이딩뷰 정신에 따라 이 스크립트 작성자는 트레이더가 기능을 검토하고 검증할 수 있도록 오픈소스로 공개했습니다. 작성자에게 찬사를 보냅니다! 무료로 사용할 수 있지만 코드를 다시 게시할 경우 하우스 룰이 적용된다는 점을 기억하세요.
면책사항
이 정보와 게시물은 TradingView에서 제공하거나 보증하는 금융, 투자, 거래 또는 기타 유형의 조언이나 권고 사항을 의미하거나 구성하지 않습니다. 자세한 내용은 이용 약관을 참고하세요.
오픈 소스 스크립트
진정한 트레이딩뷰 정신에 따라 이 스크립트 작성자는 트레이더가 기능을 검토하고 검증할 수 있도록 오픈소스로 공개했습니다. 작성자에게 찬사를 보냅니다! 무료로 사용할 수 있지만 코드를 다시 게시할 경우 하우스 룰이 적용된다는 점을 기억하세요.
면책사항
이 정보와 게시물은 TradingView에서 제공하거나 보증하는 금융, 투자, 거래 또는 기타 유형의 조언이나 권고 사항을 의미하거나 구성하지 않습니다. 자세한 내용은 이용 약관을 참고하세요.