OPEN-SOURCE SCRIPT
Buy/Sell Alert Strong Signals [TCMaster]
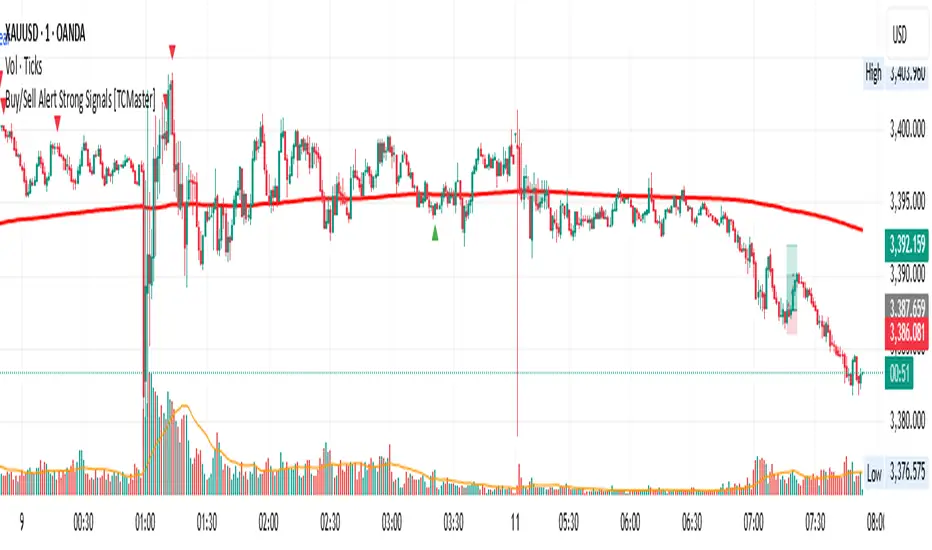
This indicator combines Smoothed Moving Averages (SMMA), Stochastic Oscillator, and popular candlestick patterns (Engulfing, 3 Line Strike) to highlight potential trend reversal zones.
Main features:
4 SMMA lines (21, 50, 100, 200) for short-, medium-, and long-term trend analysis.
Trend Fill: Background shading when EMA(2) and SMMA(200) are aligned, visually confirming trend direction.
Stochastic Filter: Filters signals based on overbought/oversold conditions to help reduce noise.
Candlestick pattern recognition:
Bullish/Bearish Engulfing
Bullish/Bearish 3 Line Strike
Alerts for each pattern when Stochastic conditions are met.
⚠️ Note: This is a technical analysis tool. It does not guarantee accuracy and is not financial advice. Always combine with other analysis methods and practice proper risk management.
🛠 How to Use:
1. SMMA Settings
21 SMMA & 50 SMMA: Short- and medium-term trend tracking.
100 SMMA: Optional mid/long-term filter (toggle on/off).
200 SMMA: Major trend direction reference.
2. Trend Fill
EMA(2) > SMMA(200): Background shaded green (uptrend bias).
EMA(2) < SMMA(200): Background shaded red (downtrend bias).
Can be enabled/disabled in settings.
3. Stochastic Filter
K Length, D Smoothing, Smooth K: Adjust sensitivity.
Overbought & Oversold: Default 80 / 20 thresholds.
Buy signals only valid if Stochastic is oversold.
Sell signals only valid if Stochastic is overbought.
4. Candlestick Patterns
3 Line Strike:
Bullish: Three consecutive bullish candles followed by one bearish candle closing below the previous, with potential reversal.
Bearish: Three consecutive bearish candles followed by one bullish candle closing above the previous, with potential reversal.
Engulfing:
Bullish: Green candle fully engulfs the prior red candle body.
Bearish: Red candle fully engulfs the prior green candle body.
5. Alerts
Alerts available for each pattern when Stochastic conditions are met.
Example: "Bullish Engulfing + Stochastic confirm".
📌 Important Notes
Do not use this indicator as the sole basis for trading decisions.
Test on a demo account before applying to live trades.
Combine with multi-timeframe analysis, volume, and proper position sizing.
오픈 소스 스크립트
트레이딩뷰의 진정한 정신에 따라, 이 스크립트의 작성자는 이를 오픈소스로 공개하여 트레이더들이 기능을 검토하고 검증할 수 있도록 했습니다. 작성자에게 찬사를 보냅니다! 이 코드는 무료로 사용할 수 있지만, 코드를 재게시하는 경우 하우스 룰이 적용된다는 점을 기억하세요.
면책사항
해당 정보와 게시물은 금융, 투자, 트레이딩 또는 기타 유형의 조언이나 권장 사항으로 간주되지 않으며, 트레이딩뷰에서 제공하거나 보증하는 것이 아닙니다. 자세한 내용은 이용 약관을 참조하세요.
오픈 소스 스크립트
트레이딩뷰의 진정한 정신에 따라, 이 스크립트의 작성자는 이를 오픈소스로 공개하여 트레이더들이 기능을 검토하고 검증할 수 있도록 했습니다. 작성자에게 찬사를 보냅니다! 이 코드는 무료로 사용할 수 있지만, 코드를 재게시하는 경우 하우스 룰이 적용된다는 점을 기억하세요.
면책사항
해당 정보와 게시물은 금융, 투자, 트레이딩 또는 기타 유형의 조언이나 권장 사항으로 간주되지 않으며, 트레이딩뷰에서 제공하거나 보증하는 것이 아닙니다. 자세한 내용은 이용 약관을 참조하세요.