INVITE-ONLY SCRIPT
[astropark] price levels
Dear Followers,
today another awesome Analysis Tool, that you can use in your trading journey: Price Levels!
Are you a range trading player? a scalper? or maybe a day-trader or a swing-trader? This is for you then. Indeed it's for everyone.
This indicator works on every timeframe, market and pair.
It keeps track of recent important levels generated by price action:
You can:
Why such indicator should be helpful? How can I use it to do profit?
In multiple ways! Let's talk about Monday Range:
Tuesday is usually a marker day within a trading week:
Thursday is the day when big players start to take profits, as the trading week is going to end the next day:
Let's talk now about the Weekly, Monthly and Yearly price levels: here it is the interesting part for Swing Traders
today another awesome Analysis Tool, that you can use in your trading journey: Price Levels!
Are you a range trading player? a scalper? or maybe a day-trader or a swing-trader? This is for you then. Indeed it's for everyone.
This indicator works on every timeframe, market and pair.
It keeps track of recent important levels generated by price action:
- Monday high, low and middle range level
- Tuesday high and low
- Wednesday high and low
- Thursday high and low
- Friday high and low
- Weekly open, high and low
- Monthly open, high and low
- Yearly open, high and low
- Previous weekly open, high and low
- Previous monthly open, high and low
- Previous yearly open, high and low
You can:
- choose price levels to hide and show
- change each level color / thickness / display style (solid or dotted)
- choose to show or hide price labels and change their size
Why such indicator should be helpful? How can I use it to do profit?
In multiple ways! Let's talk about Monday Range:
- when Monday range is formed, price acceptance below Monday low is a bearish signal, so will more likely want to short / sell
- equally price acceptance above Monday high is a bullish signal, so will more likely want to long / buy
- it can happen that Monday high is simply retested, with price not being able to stay above it: this is called a retest (in case of a simple wick) or a deviation (in case of price staying above the level just for some candles) and what usually happens is price falling back to Monday middle range level and even back to Monday low.
- the opposite can happen of course: you will become bullish if Monday low is tested or a deviation appears below Monday low: price tends to bounce on such occasions back to Monday middle range or even Monday high
Tuesday is usually a marker day within a trading week:
- if Monday was pretty bullish, Tuesday high may mark the weekly top, following some red days
- if Monday was pretty bearish, Tuesday low may mark the weekly bottom, following some green days
- Thursday is the day when big players start to take profits, as the trading week is going to end the next day, so in an all-green week Thursday may be a red one, while in an all-red week it may be a bullish day
Thursday is the day when big players start to take profits, as the trading week is going to end the next day:
- in an all-green week, Thursday may be a red one and it's low tends to mark the weekly low
- while in an all-red week, it tends to be a bullish day, so here you will refill your shorts for the next blooding day
Let's talk now about the Weekly, Monthly and Yearly price levels: here it is the interesting part for Swing Traders
- Weekly open is usually a defining level: on retest, if price keeps staying below then more downside is expected, if price keeps staying above then more upside is expected (similarly to what we said about Monday high and low)
- Monthly and Yearly open price levels are usually a "no-brainer" buy level in a bullish trend or equally a sell level in a bearish trend: in this scenarios, a deviation structure is even more powerful in term of price reaction and efficiency
- We trade Weekly, Monthly and Yearly high and low price levels as explained for the Monday high and low, but with a swing traders perspective (so a medium-long term trade)
- Previous Weekly/Monthly/Yearly price levels are usually very useful as targets in your trades
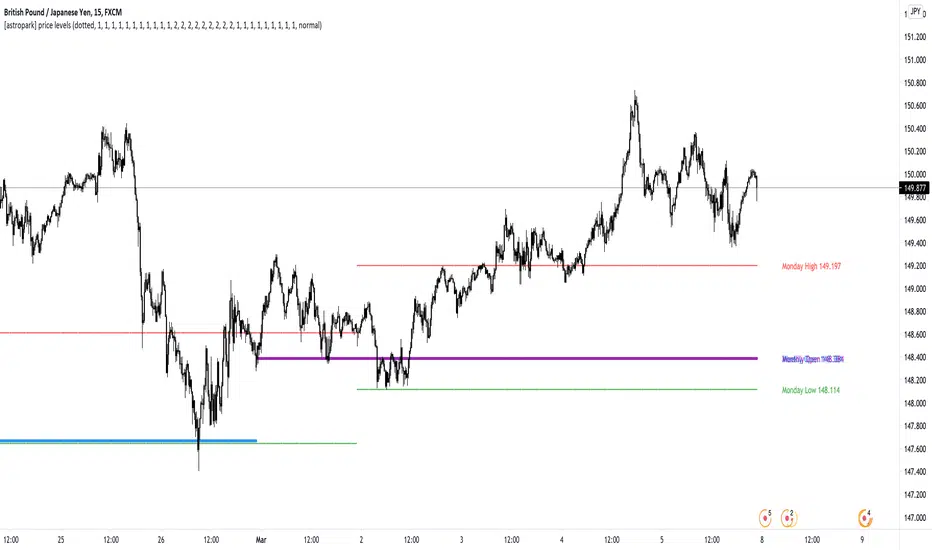
Here below some screenshots that resumes what said above.
Weekly Open as support (bullish) and Monday High deviation (bearish)
Tuesday High, Weekly Open failing as support: bearish
Monday Low deviation (bullish)
Price Acceptance above Monday High and Weekly Open (bullish)
Yearly Open retests as buy opportunities
Deviation below Monthly Open (bullish), Price Acceptance below Monthly and Yearly Open (bearish)
This is a premium indicator, so send me a private message in order to get access to this script.
초대 전용 스크립트
이 스크립트는 작성자가 승인한 사용자만 접근할 수 있습니다. 사용하려면 요청 후 승인을 받아야 하며, 일반적으로 결제 후에 허가가 부여됩니다. 자세한 내용은 아래 작성자의 안내를 따르거나 astropark에게 직접 문의하세요.
트레이딩뷰는 스크립트의 작동 방식을 충분히 이해하고 작성자를 완전히 신뢰하지 않는 이상, 해당 스크립트에 비용을 지불하거나 사용하는 것을 권장하지 않습니다. 커뮤니티 스크립트에서 무료 오픈소스 대안을 찾아보실 수도 있습니다.
작성자 지시 사항
This is not a free-to-use indicator, so send me a private message in order to get access to this script.
I'm a software engineer, passionate for trading & developing trading tools & bots! Feel free to DM me & checkout my work: bit.ly/astroparktrading
면책사항
해당 정보와 게시물은 금융, 투자, 트레이딩 또는 기타 유형의 조언이나 권장 사항으로 간주되지 않으며, 트레이딩뷰에서 제공하거나 보증하는 것이 아닙니다. 자세한 내용은 이용 약관을 참조하세요.