INVITE-ONLY SCRIPT
TwV Dynamic Multi-Timeframe Supports and Resistances
Dynamic Multi-timeframe Supports and Resistances
This indicator is designed to be able to get used in combination with others that can lead to a potential help for trading.
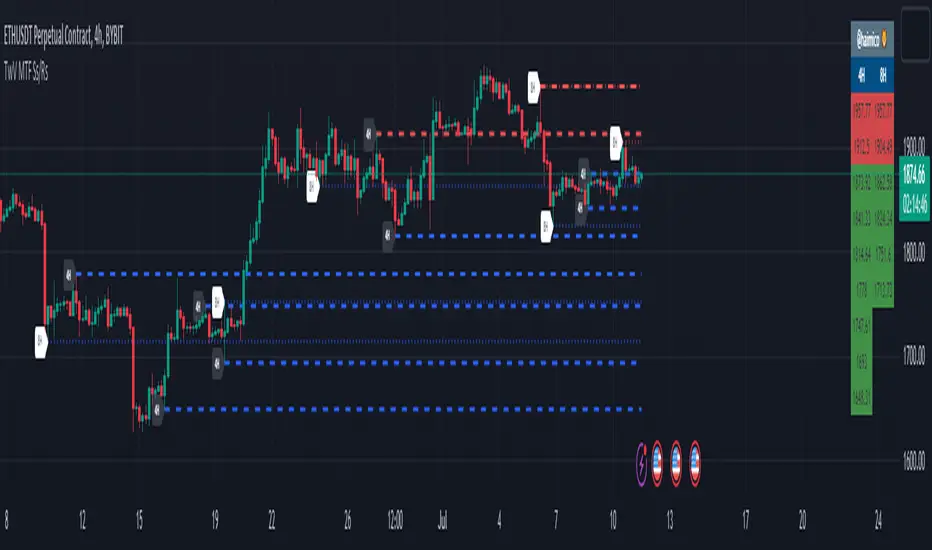
The indicator uses colors such us light blue, dark blue, light red and dark red. Light blue and light red to indicate whether we are looking at a support or resistance for the multi-timeframe and dark blue and dark red to indicate whether we are looking at a support or resistance for the current chart’s timeframe.
The indicator is multi-timeframe because the trader can configure within the menu a background timeframe, which plots new supports and resistances according to the timeframe selected. Therefore, traders can use daily or 4H supports and resistances in a 1H graph or lower. (Just as an example)
The Supports' and Resistances' for the different timeframes are clearly identified with a label at the specific candle where they are coming from.
Most Supports & Resistances indicators need to be adjusted to a FIXED LOOKBACK PERIOD, I made an improvement and different by giving the indicator the ability to identify the bars that are being LOOK AT IN THE SCREEN, this really gives traders the possibility and agility to identify potential support and resistance areas without the need to be changing any settings on the indicator. Just change the Fixed/Dynamic setting indicator to start using this great functionality.
Fundamentals
Support and resistance are two foundational concepts in technical analysis. Understanding what these terms mean and their practical application is essential to correctly reading price charts.
Prices move because of supply and demand. When demand is greater than supply, prices rise. When supply is greater than demand, prices fall. Sometimes, prices will move sideways as both supply and demand are in equilibrium.
Like many concepts in technical analysis, the explanation and rationale behind technical concepts are relatively easy, but mastery in their application often takes years of practice.
Summary Panel
This panel allows the trader to have a summary of the values of the supports and resistances. It has the following characteristics:
Script’s Basics
The idea behind the script is to find out Long-term levels are used to help predict large price reversals marking the start and completion of price movements on longer timelines such as the daily or weekly charts, to achieve this the script uses K-Means clustering to identify long-term support and resistance levels.
K-means clustering is one of the most popular algorithms, the objective of K-means is to group similar data points together and discover underlying patterns. To achieve this objective, K-means looks for a fixed number (k) of clusters in a dataset.
A cluster refers to a collection of data points aggregated together because of certain similarities. For this, a target number k has to be defined, which refers to the number of centroids it is needed in the dataset.
Every data point is allocated to each of the clusters through reducing the in-cluster sum of squares.
In other words, it identifies the k number of centroids and then allocates every data point to the nearest cluster, while keeping the centroids as small as possible.
This indicator is designed to be able to get used in combination with others that can lead to a potential help for trading.
The indicator uses colors such us light blue, dark blue, light red and dark red. Light blue and light red to indicate whether we are looking at a support or resistance for the multi-timeframe and dark blue and dark red to indicate whether we are looking at a support or resistance for the current chart’s timeframe.
The indicator is multi-timeframe because the trader can configure within the menu a background timeframe, which plots new supports and resistances according to the timeframe selected. Therefore, traders can use daily or 4H supports and resistances in a 1H graph or lower. (Just as an example)
The Supports' and Resistances' for the different timeframes are clearly identified with a label at the specific candle where they are coming from.
Most Supports & Resistances indicators need to be adjusted to a FIXED LOOKBACK PERIOD, I made an improvement and different by giving the indicator the ability to identify the bars that are being LOOK AT IN THE SCREEN, this really gives traders the possibility and agility to identify potential support and resistance areas without the need to be changing any settings on the indicator. Just change the Fixed/Dynamic setting indicator to start using this great functionality.
Fundamentals
Support and resistance are two foundational concepts in technical analysis. Understanding what these terms mean and their practical application is essential to correctly reading price charts.
Prices move because of supply and demand. When demand is greater than supply, prices rise. When supply is greater than demand, prices fall. Sometimes, prices will move sideways as both supply and demand are in equilibrium.
Like many concepts in technical analysis, the explanation and rationale behind technical concepts are relatively easy, but mastery in their application often takes years of practice.
- Technical analysts use support and resistance levels to identify price points on a chart where the probabilities favor a pause or reversal of a prevailing trend.
- Support occurs where a downtrend is expected to pause due to a concentration of demand.
- Resistance occurs where an uptrend is expected to pause temporarily, due to a concentration of supply.
- Support and resistance areas can be identified on charts using trendlines and moving averages.
Summary Panel
This panel allows the trader to have a summary of the values of the supports and resistances. It has the following characteristics:
- Can be placed anywhere in the chart.
- Its size can be modified to fit any type of screens including mobile
- The summary box the high and low prices for the supports and resistances.
Script’s Basics
The idea behind the script is to find out Long-term levels are used to help predict large price reversals marking the start and completion of price movements on longer timelines such as the daily or weekly charts, to achieve this the script uses K-Means clustering to identify long-term support and resistance levels.
K-means clustering is one of the most popular algorithms, the objective of K-means is to group similar data points together and discover underlying patterns. To achieve this objective, K-means looks for a fixed number (k) of clusters in a dataset.
A cluster refers to a collection of data points aggregated together because of certain similarities. For this, a target number k has to be defined, which refers to the number of centroids it is needed in the dataset.
Every data point is allocated to each of the clusters through reducing the in-cluster sum of squares.
In other words, it identifies the k number of centroids and then allocates every data point to the nearest cluster, while keeping the centroids as small as possible.
초대 전용 스크립트
이 스크립트는 작성자가 승인한 사용자만 접근할 수 있습니다. 사용하려면 요청 후 승인을 받아야 하며, 일반적으로 결제 후에 허가가 부여됩니다. 자세한 내용은 아래 작성자의 안내를 따르거나 haimico에게 직접 문의하세요.
트레이딩뷰는 스크립트의 작동 방식을 충분히 이해하고 작성자를 완전히 신뢰하지 않는 이상, 해당 스크립트에 비용을 지불하거나 사용하는 것을 권장하지 않습니다. 커뮤니티 스크립트에서 무료 오픈소스 대안을 찾아보실 수도 있습니다.
작성자 지시 사항
To get access to my indicators contact me via Telegram @haimico2
To get access to my indicators contact me via Telegram @haimico2
면책사항
해당 정보와 게시물은 금융, 투자, 트레이딩 또는 기타 유형의 조언이나 권장 사항으로 간주되지 않으며, 트레이딩뷰에서 제공하거나 보증하는 것이 아닙니다. 자세한 내용은 이용 약관을 참조하세요.