OPEN-SOURCE SCRIPT
Aura Vibes EMA Ribbon + VStop + SAR + Bollinger Bands
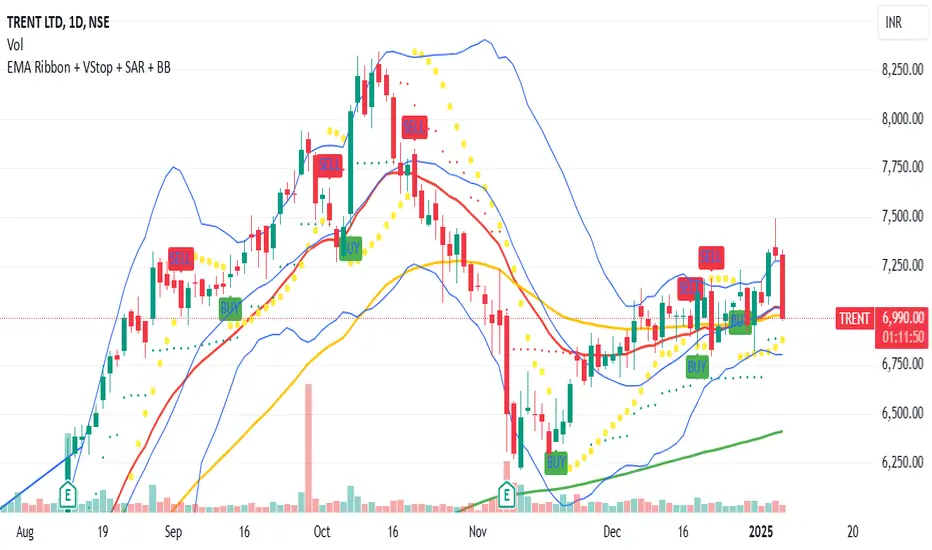
The combination of Exponential Moving Averages (EMA), Volatility Stop (VStop), Parabolic SAR (PSAR), and Bollinger Bands (BB) offers a comprehensive approach to technical analysis, each serving a distinct purpose:
Exponential Moving Averages (EMA): EMAs are used to identify the direction of the trend by smoothing price data. Shorter-period EMAs react more quickly to price changes, while longer-period EMAs provide a broader view of the trend.
Volatility Stop (VStop): VStop is a dynamic stop-loss mechanism that adjusts based on market volatility, typically using the Average True Range (ATR). This allows traders to set stop-loss levels that accommodate market fluctuations, potentially reducing the likelihood of premature stop-outs.
Parabolic SAR (PSAR): PSAR is a trend-following indicator that provides potential entry and exit points by plotting dots above or below the price chart. When the dots are below the price, it suggests an uptrend; when above, a downtrend.
Bollinger Bands (BB): BB consists of a middle band (typically a 20-period simple moving average) and two outer bands set at standard deviations above and below the middle band. These bands expand and contract based on market volatility, helping traders identify overbought or oversold conditions.
Integrating these indicators can enhance trading strategies:
Trend Identification: Use EMAs to determine the prevailing market trend. For instance, a short-term EMA crossing above a long-term EMA may signal an uptrend.
Entry and Exit Points: Combine PSAR and BB to pinpoint potential entry and exit points. For example, a PSAR dot appearing below the price during an uptrend, coinciding with the price touching the lower Bollinger Band, might indicate a buying opportunity.
Risk Management: Implement VStop to set adaptive stop-loss levels that adjust with market volatility, providing a buffer against market noise.
By thoughtfully combining these indicators, traders can develop a robust trading system that adapts to various market conditions.
오픈 소스 스크립트
트레이딩뷰의 진정한 정신에 따라, 이 스크립트의 작성자는 이를 오픈소스로 공개하여 트레이더들이 기능을 검토하고 검증할 수 있도록 했습니다. 작성자에게 찬사를 보냅니다! 이 코드는 무료로 사용할 수 있지만, 코드를 재게시하는 경우 하우스 룰이 적용된다는 점을 기억하세요.
면책사항
해당 정보와 게시물은 금융, 투자, 트레이딩 또는 기타 유형의 조언이나 권장 사항으로 간주되지 않으며, 트레이딩뷰에서 제공하거나 보증하는 것이 아닙니다. 자세한 내용은 이용 약관을 참조하세요.
오픈 소스 스크립트
트레이딩뷰의 진정한 정신에 따라, 이 스크립트의 작성자는 이를 오픈소스로 공개하여 트레이더들이 기능을 검토하고 검증할 수 있도록 했습니다. 작성자에게 찬사를 보냅니다! 이 코드는 무료로 사용할 수 있지만, 코드를 재게시하는 경우 하우스 룰이 적용된다는 점을 기억하세요.
면책사항
해당 정보와 게시물은 금융, 투자, 트레이딩 또는 기타 유형의 조언이나 권장 사항으로 간주되지 않으며, 트레이딩뷰에서 제공하거나 보증하는 것이 아닙니다. 자세한 내용은 이용 약관을 참조하세요.