OPEN-SOURCE SCRIPT
업데이트됨 ATR Mark Up/Down
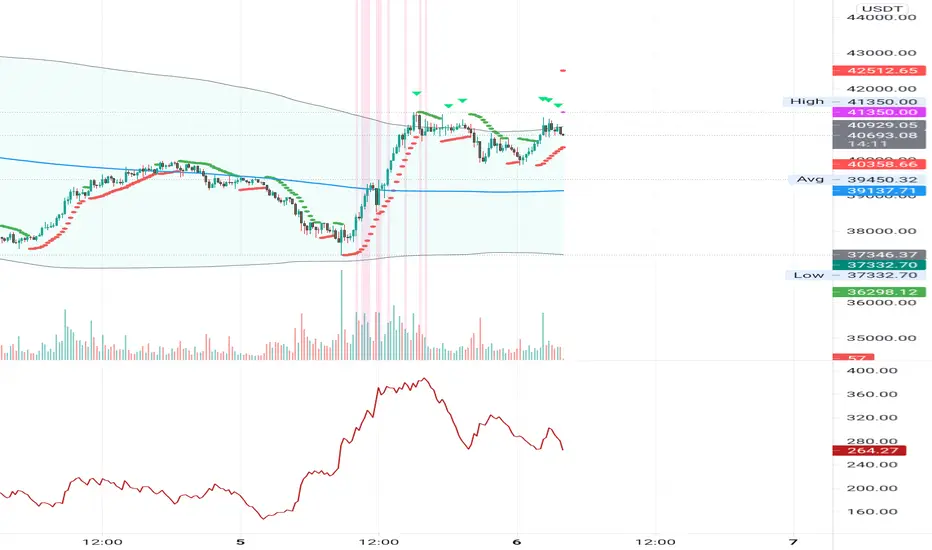
This script looks for a period with increased volatility, as measured by ATR (Average True Range), then it looks for a high or a low in that area.
When price is above EMA (200 is default, can be changed), it looks for the highs and adds multiples of ATR to the high. Default values for multipliers are 3,9 and 27, meaning that the script will show 3xATR level above the high, 9xATR above the high and 27xATR above the high.
When price is below EMA it looks for the lows and subtracts multiples of ATR from the low.The script will show 3xATR level below the low, 9xATR below the low and 27xATR below the low.
Multipliers values can be changed as well, making it a versatile tool that shows potential levels of suppport/resistance based on the volatility.
Possible use cases:
Breakout trading, when price crosses a certain level, it may show potential profit targets for trades opened at a breakout.
Stoploss helper. Many traders use ATR for their stoplosses, 1 ATR below the swing low for long trades and 1 ATR above the swing high for short trades are common values used by many traders. In this case, the Lookback value comes handy, if we want to look maybe at a more recent value for swing high/low point.
The levels shown by this indicator are not guaranteed to be or not to be reached by price, these levels should be used in confluence with other indicators and looked at as a visual helper.
That's all, hope you enjoy it!
PS.
*It does not plot the ATR. I don't know how to do it and IF it can be done
** It does not plot the EMA. If necessary,it can be added in a future update
릴리즈 노트
* select moving average type (EMA or SMA)* plot moving average
* Bollinger Bands on moving average
* highlight highs/lows at BB breaks
* filter peaks by volume (may not work as expected, use with caution, disabled by default)
* highlight ATR peaks areas
* Parabolic SAR added to better identify trend changes
오픈 소스 스크립트
트레이딩뷰의 진정한 정신에 따라, 이 스크립트의 작성자는 이를 오픈소스로 공개하여 트레이더들이 기능을 검토하고 검증할 수 있도록 했습니다. 작성자에게 찬사를 보냅니다! 이 코드는 무료로 사용할 수 있지만, 코드를 재게시하는 경우 하우스 룰이 적용된다는 점을 기억하세요.
면책사항
해당 정보와 게시물은 금융, 투자, 트레이딩 또는 기타 유형의 조언이나 권장 사항으로 간주되지 않으며, 트레이딩뷰에서 제공하거나 보증하는 것이 아닙니다. 자세한 내용은 이용 약관을 참조하세요.
오픈 소스 스크립트
트레이딩뷰의 진정한 정신에 따라, 이 스크립트의 작성자는 이를 오픈소스로 공개하여 트레이더들이 기능을 검토하고 검증할 수 있도록 했습니다. 작성자에게 찬사를 보냅니다! 이 코드는 무료로 사용할 수 있지만, 코드를 재게시하는 경우 하우스 룰이 적용된다는 점을 기억하세요.
면책사항
해당 정보와 게시물은 금융, 투자, 트레이딩 또는 기타 유형의 조언이나 권장 사항으로 간주되지 않으며, 트레이딩뷰에서 제공하거나 보증하는 것이 아닙니다. 자세한 내용은 이용 약관을 참조하세요.