PROTECTED SOURCE SCRIPT
1337PA
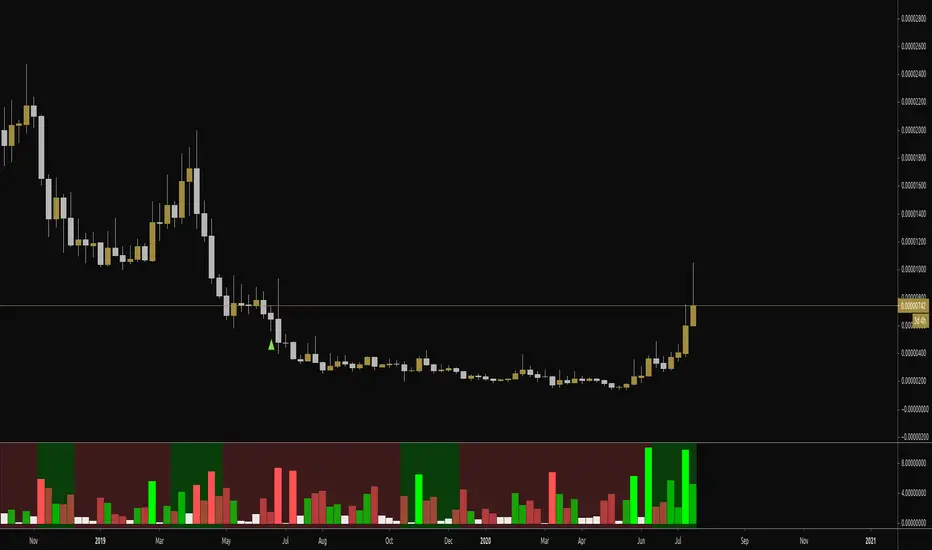
This script looks at % moves and uses z-scoring to highlight bars that are statistically significant in either direction.
The output columns values represent % moves within a trading period on an asset. The colors are explained below:
Lime - Significant
Bright red - Significant
Transparent lime - normal
Transparent red - normal
White - low %
It then uses a lookback function for a user-defined window and calculates the average % move on bullish bars and bearish bars.
When the average % move in the bullish direction over the lookback window becomes greater than the average % move in the bearish direction over the lookback window, it will highlight the background either green or red, signifying a trend in price.
It's a fantastic indicator to use in conjunction with

, which does similar things but for volume .
You can spot disparities in volume / price action and use that to inform trading decisions... for instance, a statistically significant volume day but a low significant PA day could provide some insight into the market.
You can also use the background (trend direction) in conjunction with the obv printout on 1337-Volume as multiple points of confirmation for trade decisions... i.e., volume and price action trend logic points to bearish or bullish outcome... or maybe price action is leaning bullish but volume suggests otherwise...
Enjoy!
The output columns values represent % moves within a trading period on an asset. The colors are explained below:
Lime - Significant
Bright red - Significant
Transparent lime - normal
Transparent red - normal
White - low %
It then uses a lookback function for a user-defined window and calculates the average % move on bullish bars and bearish bars.
When the average % move in the bullish direction over the lookback window becomes greater than the average % move in the bearish direction over the lookback window, it will highlight the background either green or red, signifying a trend in price.
It's a fantastic indicator to use in conjunction with
, which does similar things but for volume .
You can spot disparities in volume / price action and use that to inform trading decisions... for instance, a statistically significant volume day but a low significant PA day could provide some insight into the market.
You can also use the background (trend direction) in conjunction with the obv printout on 1337-Volume as multiple points of confirmation for trade decisions... i.e., volume and price action trend logic points to bearish or bullish outcome... or maybe price action is leaning bullish but volume suggests otherwise...
Enjoy!
보호된 스크립트입니다
이 스크립트는 비공개 소스로 게시됩니다. 하지만 이를 자유롭게 제한 없이 사용할 수 있습니다 – 자세한 내용은 여기에서 확인하세요.
면책사항
해당 정보와 게시물은 금융, 투자, 트레이딩 또는 기타 유형의 조언이나 권장 사항으로 간주되지 않으며, 트레이딩뷰에서 제공하거나 보증하는 것이 아닙니다. 자세한 내용은 이용 약관을 참조하세요.
보호된 스크립트입니다
이 스크립트는 비공개 소스로 게시됩니다. 하지만 이를 자유롭게 제한 없이 사용할 수 있습니다 – 자세한 내용은 여기에서 확인하세요.
면책사항
해당 정보와 게시물은 금융, 투자, 트레이딩 또는 기타 유형의 조언이나 권장 사항으로 간주되지 않으며, 트레이딩뷰에서 제공하거나 보증하는 것이 아닙니다. 자세한 내용은 이용 약관을 참조하세요.