INVITE-ONLY SCRIPT
업데이트됨 Reversal Indicator
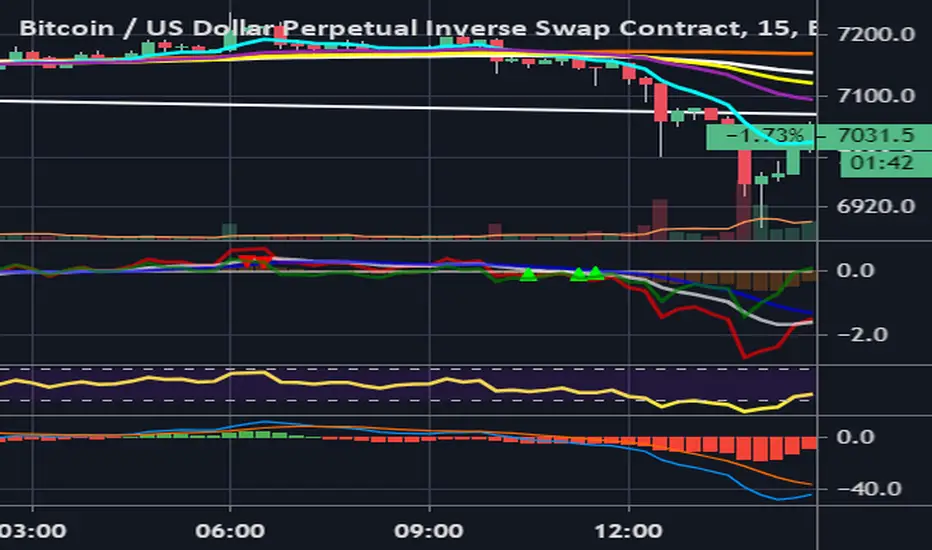
Divergence Indicator
릴리즈 노트
Indicator is similar to RSI, but isn't range bound (no maximum or minimum). Buy or sell signals are recognized, when connecting line of vertexes on the red line diverge with connecting line of vertexes on the green line. White line is lagging trend line (like MA). When it is above zero axis, it is signaling uptrend and vice versa. The strength of trend is measured by how the red line sustain above the white line and how often the two cross. Indicator can be used on all timeframes, but the higher the timeframe, the stronger the signal with less noise and the greater is the expected move. For example when there is a signal to sell on 1D, 12h and 8h timeframes, it is best to look for good entry signals on 1h, 30m and 15m. On small timeframes (1m - 5m) it works very well during high volatility and high volume periods. During low volume periods there is more noise.
Compared to RSI there are signals formed in times when there is no divergence on RSI.
릴리즈 노트
Added blue signal line릴리즈 노트
.릴리즈 노트
Added visual long and short signals.릴리즈 노트
Added alerts for long and short signals릴리즈 노트
Added histogram and signal line초대 전용 스크립트
이 스크립트는 작성자가 승인한 사용자만 접근할 수 있습니다. 사용하려면 요청 후 승인을 받아야 하며, 일반적으로 결제 후에 허가가 부여됩니다. 자세한 내용은 아래 작성자의 안내를 따르거나 ladaklada에게 직접 문의하세요.
트레이딩뷰는 스크립트의 작동 방식을 충분히 이해하고 작성자를 완전히 신뢰하지 않는 이상, 해당 스크립트에 비용을 지불하거나 사용하는 것을 권장하지 않습니다. 커뮤니티 스크립트에서 무료 오픈소스 대안을 찾아보실 수도 있습니다.
작성자 지시 사항
면책사항
해당 정보와 게시물은 금융, 투자, 트레이딩 또는 기타 유형의 조언이나 권장 사항으로 간주되지 않으며, 트레이딩뷰에서 제공하거나 보증하는 것이 아닙니다. 자세한 내용은 이용 약관을 참조하세요.
초대 전용 스크립트
이 스크립트는 작성자가 승인한 사용자만 접근할 수 있습니다. 사용하려면 요청 후 승인을 받아야 하며, 일반적으로 결제 후에 허가가 부여됩니다. 자세한 내용은 아래 작성자의 안내를 따르거나 ladaklada에게 직접 문의하세요.
트레이딩뷰는 스크립트의 작동 방식을 충분히 이해하고 작성자를 완전히 신뢰하지 않는 이상, 해당 스크립트에 비용을 지불하거나 사용하는 것을 권장하지 않습니다. 커뮤니티 스크립트에서 무료 오픈소스 대안을 찾아보실 수도 있습니다.
작성자 지시 사항
면책사항
해당 정보와 게시물은 금융, 투자, 트레이딩 또는 기타 유형의 조언이나 권장 사항으로 간주되지 않으며, 트레이딩뷰에서 제공하거나 보증하는 것이 아닙니다. 자세한 내용은 이용 약관을 참조하세요.