OPEN-SOURCE SCRIPT
Math by Thomas Swing Range

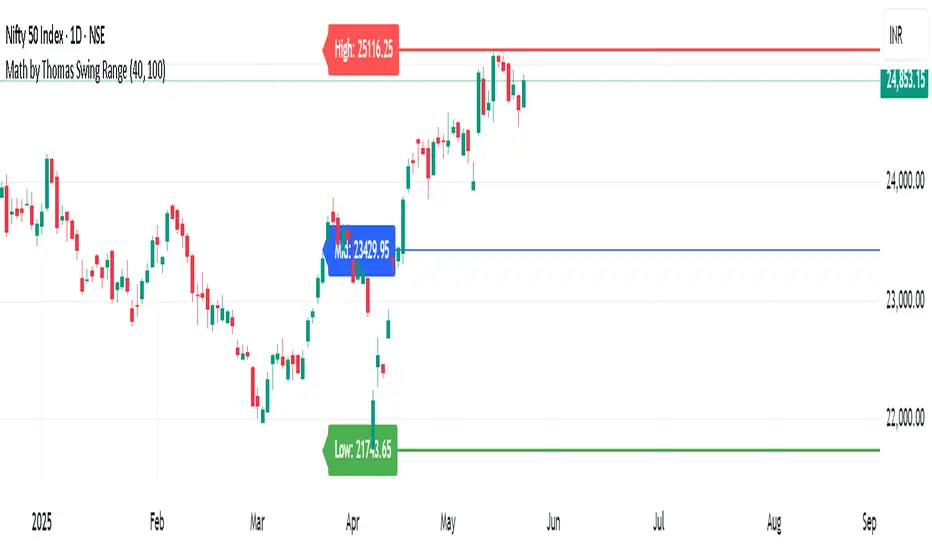
Math by Thomas Swing Range is a simple yet powerful tool designed to visually highlight key swing levels in the market based on a user-defined lookback period. It identifies the highest high, lowest low, and calculates the midpoint between them — creating a clear range for swing trading strategies.
These levels can help traders:
Spot potential support and resistance zones
Analyze price rejection near range boundaries
Frame mean-reversion or breakout setups
The indicator continuously updates and extends these lines into the future, making it easier to plan and manage trades with visual clarity.
🛠️ How to Use
Add to Chart:
Apply the indicator on any timeframe and asset (works best on higher timeframes like 1H, 4H, or Daily).
Configure Parameters:
Lookback Period: Number of candles used to detect the highest high and lowest low. Default is 20.
Extend Lines by N Bars: Number of future bars the levels should be projected to the right.
Interpret Lines:
🔴 Red Line: Swing High (Resistance)
🟢 Green Line: Swing Low (Support)
🔵 Blue Line: Midpoint (Mean level — useful for equilibrium-based strategies)
Trade Ideas:
Bounce trades from swing high/low zones.
Breakout confirmation if price closes strongly outside the range.
Reversion trades if price moves toward the midpoint after extreme moves.
오픈 소스 스크립트
트레이딩뷰의 진정한 정신에 따라, 이 스크립트의 작성자는 이를 오픈소스로 공개하여 트레이더들이 기능을 검토하고 검증할 수 있도록 했습니다. 작성자에게 찬사를 보냅니다! 이 코드는 무료로 사용할 수 있지만, 코드를 재게시하는 경우 하우스 룰이 적용된다는 점을 기억하세요.
면책사항
해당 정보와 게시물은 금융, 투자, 트레이딩 또는 기타 유형의 조언이나 권장 사항으로 간주되지 않으며, 트레이딩뷰에서 제공하거나 보증하는 것이 아닙니다. 자세한 내용은 이용 약관을 참조하세요.
오픈 소스 스크립트
트레이딩뷰의 진정한 정신에 따라, 이 스크립트의 작성자는 이를 오픈소스로 공개하여 트레이더들이 기능을 검토하고 검증할 수 있도록 했습니다. 작성자에게 찬사를 보냅니다! 이 코드는 무료로 사용할 수 있지만, 코드를 재게시하는 경우 하우스 룰이 적용된다는 점을 기억하세요.
면책사항
해당 정보와 게시물은 금융, 투자, 트레이딩 또는 기타 유형의 조언이나 권장 사항으로 간주되지 않으며, 트레이딩뷰에서 제공하거나 보증하는 것이 아닙니다. 자세한 내용은 이용 약관을 참조하세요.