OPEN-SOURCE SCRIPT
MultiTFlevels with Volume Display
1. Overview
This indicator is intended for use on trading platforms like TradingView and provides the following features:
Volume Profile Analysis:
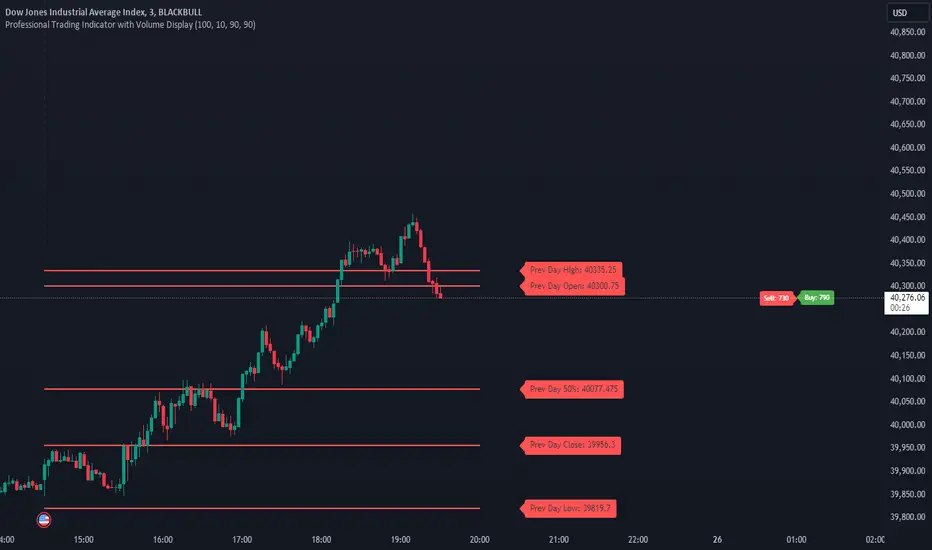
Shows cumulative volume delta (CVD) and displays buying and selling volumes.
Historical OHLC Levels:
Plots historical open, high, low, and close levels for various timeframes (e.g., daily, weekly, monthly).
Customizable Settings:
Allows users to toggle different elements and customize display options.
2. Inputs
Timeframe Display Toggles:
Users can choose to display OHLC levels from different timeframes such as previous month, week, day, 4H, 1H, 30M, 15M, and 5M.
CVD Display Toggle: Option to show or hide the Cumulative Volume Delta (CVD).
Line and Label Customization:
leftOffset and rightOffset: Define how far lines are extended left and right from the current bar.
colorMonth, colorWeek, etc.: Customize colors for different timeframe OHLC levels.
labelOffset and rightOffset: Control the positioning of volume labels.
3. Key Features
Cumulative Volume Delta (CVD)
Calculation:
Computes the cumulative volume delta by adding or subtracting the volume based on whether the close price is higher or lower than the open price.
Display:
Shows a label on the chart indicating the current CVD value and whether the market is leaning towards buying or selling.
Historical OHLC Levels
Data Retrieval:
Uses the request.security function to fetch OHLC data from different timeframes (e.g., monthly, weekly, daily).
Plotting:
Draws lines and labels on the chart to represent open, high, low, and close levels for each selected timeframe.
Buying and Selling Volumes
Calculation:
Calculates buying and selling volumes based on whether the close price is higher or lower than the open price.
Display:
Shows labels on the chart for buying and selling volumes.
4. Functions
getOHLC(timeframe)
Retrieves open, high, low, and close values from the specified timeframe.
plotOHLC(show, open, high, low, close, col, prefix)
Draws OHLC lines and labels on the chart for the given timeframe and color.
5. Usage
Chart Overlay: The indicator is overlaid on the main chart (i.e., it appears directly on the price chart).
Historical Analysis:
Useful for analyzing historical price levels and volume dynamics across different timeframes.
Volume Insights:
Helps traders understand the cumulative volume behavior and market sentiment through the CVD and volume labels.
In essence, this indicator provides a comprehensive view of historical price levels across multiple timeframes and the dynamics of market volume through CVD and volume labels. It can be particularly useful for traders looking to combine price action with volume analysis for a more in-depth market assessment.
This indicator is intended for use on trading platforms like TradingView and provides the following features:
Volume Profile Analysis:
Shows cumulative volume delta (CVD) and displays buying and selling volumes.
Historical OHLC Levels:
Plots historical open, high, low, and close levels for various timeframes (e.g., daily, weekly, monthly).
Customizable Settings:
Allows users to toggle different elements and customize display options.
2. Inputs
Timeframe Display Toggles:
Users can choose to display OHLC levels from different timeframes such as previous month, week, day, 4H, 1H, 30M, 15M, and 5M.
CVD Display Toggle: Option to show or hide the Cumulative Volume Delta (CVD).
Line and Label Customization:
leftOffset and rightOffset: Define how far lines are extended left and right from the current bar.
colorMonth, colorWeek, etc.: Customize colors for different timeframe OHLC levels.
labelOffset and rightOffset: Control the positioning of volume labels.
3. Key Features
Cumulative Volume Delta (CVD)
Calculation:
Computes the cumulative volume delta by adding or subtracting the volume based on whether the close price is higher or lower than the open price.
Display:
Shows a label on the chart indicating the current CVD value and whether the market is leaning towards buying or selling.
Historical OHLC Levels
Data Retrieval:
Uses the request.security function to fetch OHLC data from different timeframes (e.g., monthly, weekly, daily).
Plotting:
Draws lines and labels on the chart to represent open, high, low, and close levels for each selected timeframe.
Buying and Selling Volumes
Calculation:
Calculates buying and selling volumes based on whether the close price is higher or lower than the open price.
Display:
Shows labels on the chart for buying and selling volumes.
4. Functions
getOHLC(timeframe)
Retrieves open, high, low, and close values from the specified timeframe.
plotOHLC(show, open, high, low, close, col, prefix)
Draws OHLC lines and labels on the chart for the given timeframe and color.
5. Usage
Chart Overlay: The indicator is overlaid on the main chart (i.e., it appears directly on the price chart).
Historical Analysis:
Useful for analyzing historical price levels and volume dynamics across different timeframes.
Volume Insights:
Helps traders understand the cumulative volume behavior and market sentiment through the CVD and volume labels.
In essence, this indicator provides a comprehensive view of historical price levels across multiple timeframes and the dynamics of market volume through CVD and volume labels. It can be particularly useful for traders looking to combine price action with volume analysis for a more in-depth market assessment.
오픈 소스 스크립트
트레이딩뷰의 진정한 정신에 따라, 이 스크립트의 작성자는 이를 오픈소스로 공개하여 트레이더들이 기능을 검토하고 검증할 수 있도록 했습니다. 작성자에게 찬사를 보냅니다! 이 코드는 무료로 사용할 수 있지만, 코드를 재게시하는 경우 하우스 룰이 적용된다는 점을 기억하세요.
면책사항
해당 정보와 게시물은 금융, 투자, 트레이딩 또는 기타 유형의 조언이나 권장 사항으로 간주되지 않으며, 트레이딩뷰에서 제공하거나 보증하는 것이 아닙니다. 자세한 내용은 이용 약관을 참조하세요.
오픈 소스 스크립트
트레이딩뷰의 진정한 정신에 따라, 이 스크립트의 작성자는 이를 오픈소스로 공개하여 트레이더들이 기능을 검토하고 검증할 수 있도록 했습니다. 작성자에게 찬사를 보냅니다! 이 코드는 무료로 사용할 수 있지만, 코드를 재게시하는 경우 하우스 룰이 적용된다는 점을 기억하세요.
면책사항
해당 정보와 게시물은 금융, 투자, 트레이딩 또는 기타 유형의 조언이나 권장 사항으로 간주되지 않으며, 트레이딩뷰에서 제공하거나 보증하는 것이 아닙니다. 자세한 내용은 이용 약관을 참조하세요.