PROTECTED SOURCE SCRIPT
업데이트됨 Best Liquidity Indicator v0.6.3
Best Liquidity Indicator (BLI)
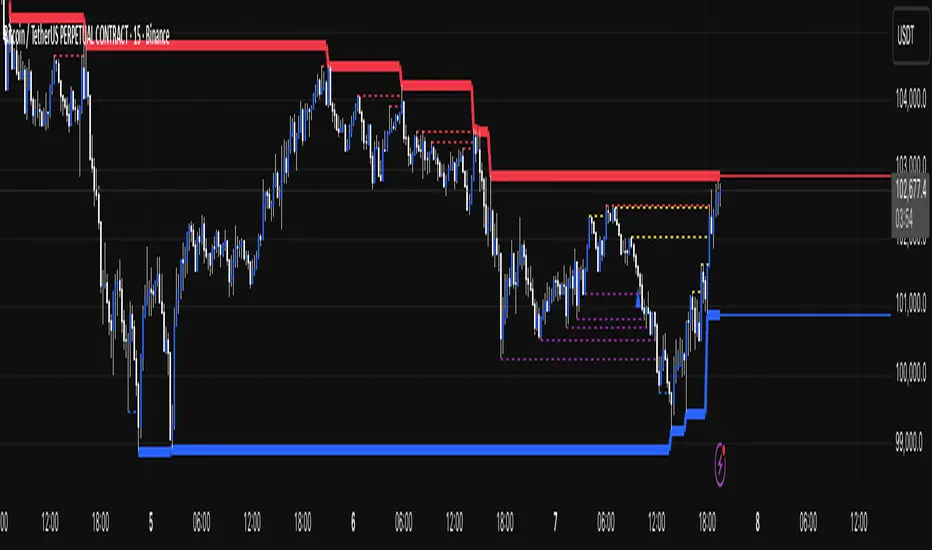
BLI maps where liquidity typically sits—and when it gets taken. It automatically draws:
BLI maps where liquidity typically sits—and when it gets taken. It automatically draws:
- Sell-side liquidity (SSL) levels and Buy-side liquidity (BSL) levels
- Liquidity grabs when price runs a level
- Ex-liquidity (invalidated/older grabs) to show the evolving path of least resistance
- (Optional) Liquidity Rails: continuous, flat “stairs” that follow only active liquidity levels to give you a smooth, higher-level read of the market’s liquidity envelope
- (Optional) the same logic from a higher timeframe (e.g., 4H) overlaid on your current chart
릴리즈 노트
- Fixed issues preventing HTF liquidity levels from showing on the chart.
- Made Improvements to the Liquidity rail lines. (Further improvements to come in next version.
보호된 스크립트입니다
이 스크립트는 비공개 소스로 게시됩니다. 하지만 제한 없이 자유롭게 사용할 수 있습니다 — 여기에서 자세히 알아보기.
면책사항
이 정보와 게시물은 TradingView에서 제공하거나 보증하는 금융, 투자, 거래 또는 기타 유형의 조언이나 권고 사항을 의미하거나 구성하지 않습니다. 자세한 내용은 이용 약관을 참고하세요.
보호된 스크립트입니다
이 스크립트는 비공개 소스로 게시됩니다. 하지만 제한 없이 자유롭게 사용할 수 있습니다 — 여기에서 자세히 알아보기.
면책사항
이 정보와 게시물은 TradingView에서 제공하거나 보증하는 금융, 투자, 거래 또는 기타 유형의 조언이나 권고 사항을 의미하거나 구성하지 않습니다. 자세한 내용은 이용 약관을 참고하세요.