OPEN-SOURCE SCRIPT
업데이트됨 Proximity indicator
**What This Script Does**
This script is a unified, multi-dimensional tool designed for traders to analyze critical price dynamics and trends. It calculates and displays the following key metrics:
1. **Proximity to 52-Week Price**: Highlights the percentage distance of the current price from long-term support and resistance levels.
2. **Deviation from Key Moving Averages**: Measures how far the current price is from significant moving averages to provide insight into short-, medium-, and long-term trends.
3. **Average Daily Range Percentage (ADR%)**: Tracks price volatility over a 14-day period, helping traders gauge market activity and risk.
4. **3-Month Low Rebound Percentage**: Calculates the percentage rebound from the lowest price of the past three months, giving mid-term trend perspective.
This combination provides a holistic view of a stock’s position in the market and its current trend strength, making it easier to assess momentum, reversals, and volatility at a glance.
#### **How It Works**
1. **52-Week Proximity**:
- The script calculates the highest and lowest daily prices over the past 252 trading days (approx. 1 year) and compares them to the current closing price.
- It expresses the distance as a percentage, with proximity to the high indicating strength and proximity to the low suggesting weakness or oversold conditions.
2. **Moving Average Deviation**:
- You can select between **Simple Moving Average (SMA)** or **Exponential Moving Average (EMA)** for the calculations.
3. **ADR% (Volatility)**:
- It calculates the average daily price range (high - low) over the last 14 trading days and expresses it as a percentage of the current closing price.
- This metric helps traders understand current market volatility.
4. **3-Month Low Rebound**:
- It identifies the lowest price over the last 66 trading days (approx. 3 months) and calculates how much the price has rebounded from this level, expressed as a percentage.
.####**Interpretation**:
- Combine metrics for richer insights:
- A small deviation from the 10-day MA with high ADR% might indicate short-term momentum.
- A price near the 52-week high with a wide gap from the 200-day MA may signal a strong bullish trend but could also be overextended.
####**Purpose-Driven Consolidation**:
- Unlike individual indicators, this script integrates **trend**, **momentum**, and **volatility** measures in a single, cohesive framework. It’s specifically designed to complement how these elements interact in real-world trading scenarios.
릴리즈 노트
Cumulative RVOL for the daily Timeframe 릴리즈 노트
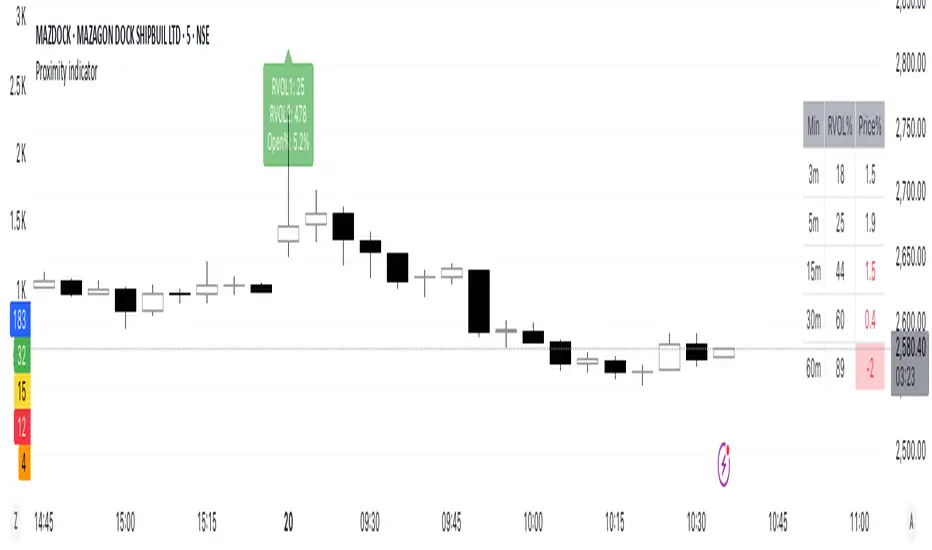
RVOL (Relative Volume) IndicatorThe RVOL indicator measures the volume activity of the first n-minute candle of the trading day relative to its historical average.
How It Works:
Current Volume: Captures the volume of the first n-minute candle of the current day.
Historical Average: Calculates the average volume of the first n-minute candle over the past m trading days (excluding the current day).
Relative Volume -->RVOL 2= (Current Volume / Historical Average Volume)
릴리즈 노트
Bug Fix, cumulative RVOL on daily TF릴리즈 노트
A table with two key metrics over different intraday timeframes added:RVOL % (Relative Volume %)
- Measures current volume compared to the average volume over the last 21 days.
- Helps identify if a stock is trading at unusually high or low volume.
- Higher RVOL (>100%) → Increased interest, possible momentum.
- Lower RVOL (<100%) → Below-average activity, lack of participation.
% Price Change
- Shows how the stock’s price has changed from the previous day’s close at different time intervals.
- Negative % (Red Background): Bearish move
Columns in the Table:
- Min: The time interval for calculating RVOL and price change.
- RVOL%: The relative volume percentage for that time interval.
- Price%: The percentage change in price compared to the previous day's close.
- Rows in the Table (Time Intervals):
릴리즈 노트
Fix: RVOL calculation use current day Volume is excluded오픈 소스 스크립트
트레이딩뷰의 진정한 정신에 따라, 이 스크립트의 작성자는 이를 오픈소스로 공개하여 트레이더들이 기능을 검토하고 검증할 수 있도록 했습니다. 작성자에게 찬사를 보냅니다! 이 코드는 무료로 사용할 수 있지만, 코드를 재게시하는 경우 하우스 룰이 적용된다는 점을 기억하세요.
면책사항
해당 정보와 게시물은 금융, 투자, 트레이딩 또는 기타 유형의 조언이나 권장 사항으로 간주되지 않으며, 트레이딩뷰에서 제공하거나 보증하는 것이 아닙니다. 자세한 내용은 이용 약관을 참조하세요.
오픈 소스 스크립트
트레이딩뷰의 진정한 정신에 따라, 이 스크립트의 작성자는 이를 오픈소스로 공개하여 트레이더들이 기능을 검토하고 검증할 수 있도록 했습니다. 작성자에게 찬사를 보냅니다! 이 코드는 무료로 사용할 수 있지만, 코드를 재게시하는 경우 하우스 룰이 적용된다는 점을 기억하세요.
면책사항
해당 정보와 게시물은 금융, 투자, 트레이딩 또는 기타 유형의 조언이나 권장 사항으로 간주되지 않으며, 트레이딩뷰에서 제공하거나 보증하는 것이 아닙니다. 자세한 내용은 이용 약관을 참조하세요.