OPEN-SOURCE SCRIPT
업데이트됨 Follow Trend - Wall Street Strategy
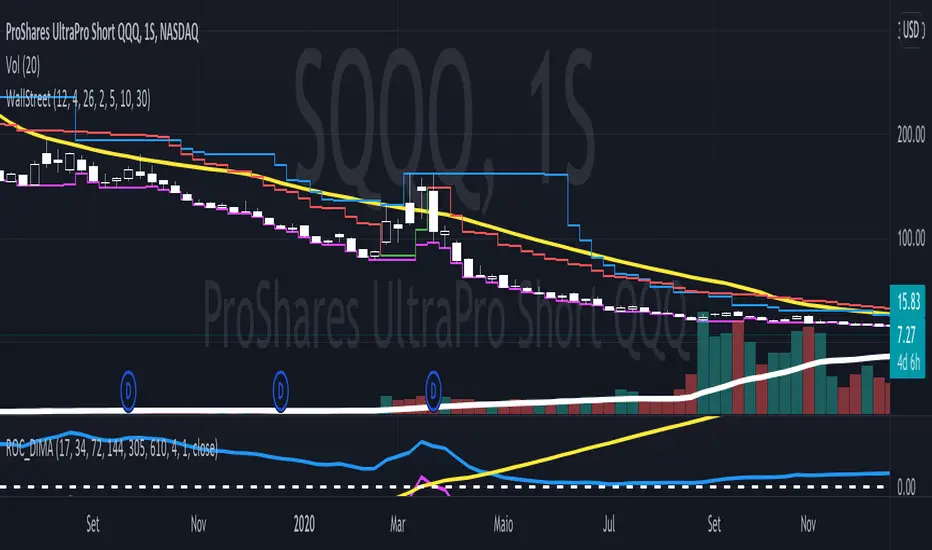
It is a mix of three common indicators, they are The High band level of Donchian Channel, 6 emas (17, 34, 72, 144, 200 and 305), and 2 VStop with different multipliers.
We search stocks are going higher and higher each time. So we look at the High-level Donchian band and if the price made a little correction and didn't touch the VStop indicator and, the price is higher than all the ema's. So we try to buy the stocks when it pass through the last highest price.
The Vstop-short we use to stocks and commodities.
The VStop-long, we use to Bonds and Reits.
In order to help, there is a triangle when the price crossover any VStop, at least the half of Donchian period.
릴리즈 노트
I forgot one of the ema's릴리즈 노트
There are some other possibilities about crossing price and VStop-short and VStop-long that I was forgot. Now it is complete!릴리즈 노트
Some wrong indication on it touch the VStop릴리즈 노트
EMA's change color to green when the price is upper than ema's and they are red when the price is lower than they.릴리즈 노트
1 -I put the correct name of each ema in plot and now they are the same at the user display2- All the important values are showing at the end . There is a resume of our strategy, Its show the start price (the highest value + 0.01), the short-stop value, the long-stop value and its brings if all the price is higher then all ema's ploted. If one of the ema's is above the price, it will show the ema's problem and don;t shows the our strategy value.
릴리즈 노트
Legend text now is white, not black.릴리즈 노트
User can choose DarkTheme or LightTheme on the legends릴리즈 노트
Now its show the relation risc vs return at each ATR릴리즈 노트
In some stocks, we don't have enough data to calculate large ema's, so in these cases, the strategy shows Ema's Bad but it isn't true. we don't have enough data to calculate it. In those cases, we will ignore them. When the close price was below ema our script says it was bad, but it isn't true either. It is irrelevant for our strategy because the price along the week was above the ema, so now we calculate the ema using the high price along the week.
릴리즈 노트
I changed some indicators colors. I added dashed extend lines to show here are the vstop, vstop2 and buyprice.릴리즈 노트
DarkTheme is working nowSubtract some indicators that we didn't use anymore.
Now is more simply. They are project to weekly graphcs.
릴리즈 노트
Correction on value of Donchian Bottom릴리즈 노트
Change Colors on Donchian Bottom and EMA2릴리즈 노트
Change Line Styles릴리즈 노트
The Vstop line has two color. When the vstop price is less than close price the line will be green and when the vstop price is higher then close price it will be red.오픈 소스 스크립트
트레이딩뷰의 진정한 정신에 따라, 이 스크립트의 작성자는 이를 오픈소스로 공개하여 트레이더들이 기능을 검토하고 검증할 수 있도록 했습니다. 작성자에게 찬사를 보냅니다! 이 코드는 무료로 사용할 수 있지만, 코드를 재게시하는 경우 하우스 룰이 적용된다는 점을 기억하세요.
면책사항
해당 정보와 게시물은 금융, 투자, 트레이딩 또는 기타 유형의 조언이나 권장 사항으로 간주되지 않으며, 트레이딩뷰에서 제공하거나 보증하는 것이 아닙니다. 자세한 내용은 이용 약관을 참조하세요.
오픈 소스 스크립트
트레이딩뷰의 진정한 정신에 따라, 이 스크립트의 작성자는 이를 오픈소스로 공개하여 트레이더들이 기능을 검토하고 검증할 수 있도록 했습니다. 작성자에게 찬사를 보냅니다! 이 코드는 무료로 사용할 수 있지만, 코드를 재게시하는 경우 하우스 룰이 적용된다는 점을 기억하세요.
면책사항
해당 정보와 게시물은 금융, 투자, 트레이딩 또는 기타 유형의 조언이나 권장 사항으로 간주되지 않으며, 트레이딩뷰에서 제공하거나 보증하는 것이 아닙니다. 자세한 내용은 이용 약관을 참조하세요.