OPEN-SOURCE SCRIPT
Previous Day Levels
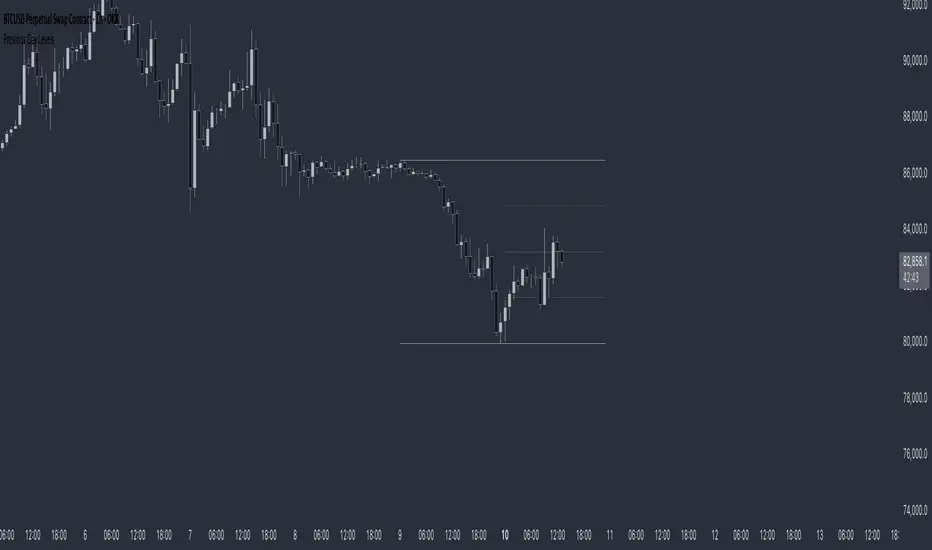
This indicator plots the previous day's high, low, and 50% levels, providing a framework for analyzing price behavior relative to these key levels.
Full Description:
The Previous Day Levels indicator is a tool designed to help traders analyze price action based on key levels from the previous trading session. By plotting the high, low, and mid-point (50%) of the prior day’s range, traders can assess potential market bias and directional tendencies for the current trading day.
Key Features:
Plots the previous day’s high (100%), low (0%), and intermediate levels (25%, 50%, 75%).
Allows users to customize line visibility, color, style, and width.
Helps traders identify potential support and resistance zones.
Provides a bias framework for determining whether price is more likely to target the previous high or low based on behavior around the 50% level.
Use Case:
This indicator is particularly useful for intraday and short-term traders who incorporate price action into their strategy.
If price trades above the 50% level and holds, it suggests a bullish bias, indicating that price may aim for the previous day's high.
If price trades below the 50% level and holds, it suggests a bearish bias, indicating that price may aim for the previous day's low.
The high and low levels can act as key support and resistance zones, where price may react or reverse.
How to Use:
Apply the indicator to your chart.
Observe how price interacts with the 50% level.
Use price behavior around these levels to establish a directional bias.
Adjust the line styles and colors to match your personal preference.
Disclaimer:
This indicator is a tool for market analysis and does not provide financial advice. Always perform your own analysis and risk management when trading.
오픈 소스 스크립트
트레이딩뷰의 진정한 정신에 따라, 이 스크립트의 작성자는 이를 오픈소스로 공개하여 트레이더들이 기능을 검토하고 검증할 수 있도록 했습니다. 작성자에게 찬사를 보냅니다! 이 코드는 무료로 사용할 수 있지만, 코드를 재게시하는 경우 하우스 룰이 적용된다는 점을 기억하세요.
면책사항
해당 정보와 게시물은 금융, 투자, 트레이딩 또는 기타 유형의 조언이나 권장 사항으로 간주되지 않으며, 트레이딩뷰에서 제공하거나 보증하는 것이 아닙니다. 자세한 내용은 이용 약관을 참조하세요.
오픈 소스 스크립트
트레이딩뷰의 진정한 정신에 따라, 이 스크립트의 작성자는 이를 오픈소스로 공개하여 트레이더들이 기능을 검토하고 검증할 수 있도록 했습니다. 작성자에게 찬사를 보냅니다! 이 코드는 무료로 사용할 수 있지만, 코드를 재게시하는 경우 하우스 룰이 적용된다는 점을 기억하세요.
면책사항
해당 정보와 게시물은 금융, 투자, 트레이딩 또는 기타 유형의 조언이나 권장 사항으로 간주되지 않으며, 트레이딩뷰에서 제공하거나 보증하는 것이 아닙니다. 자세한 내용은 이용 약관을 참조하세요.