OPEN-SOURCE SCRIPT
Overnight High/Low
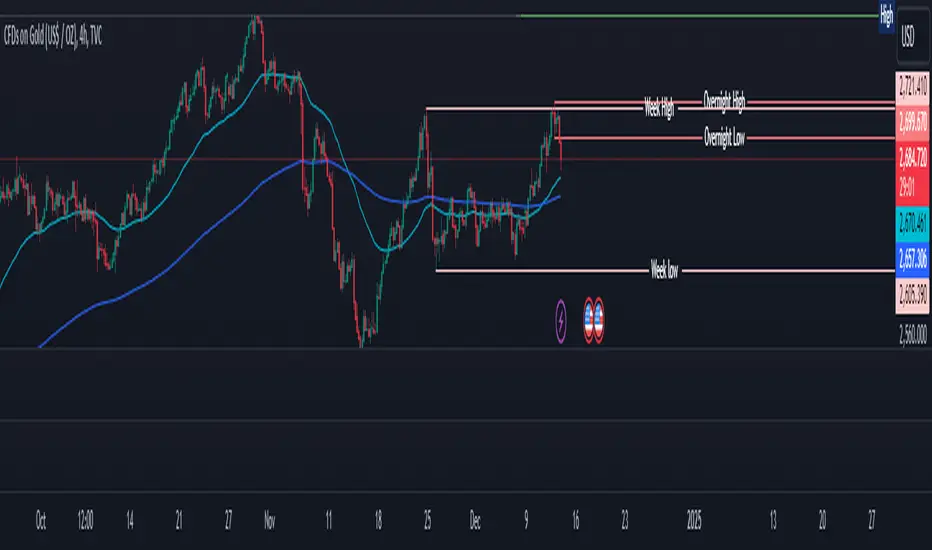
The script identifies the Overnight High (the highest price) and Overnight Low (the lowest price) for a trading instrument during a specified overnight session. It then plots these levels on the chart for reference in subsequent trading sessions.
Key Features:
Time Settings:
The script defines the start (startHour) and end (endHour + endMinute) times for the overnight session.
The session spans across two calendar days, such as 5:00 PM (17:00) to 9:30 AM (09:30).
Tracking High and Low:
During the overnight session, the script dynamically tracks:
Overnight High: The highest price reached during the session.
Overnight Low: The lowest price reached during the session.
Reset Mechanism:
After the overnight session ends (at the specified end time), the script resets the overnightHigh and overnightLow variables, preparing for the next session.
Visual Representation:
The script uses horizontal dotted lines to plot:
A green line for the Overnight High.
A red line for the Overnight Low.
These lines extend to the right of the chart, providing visual reference points for traders.
How It Works:
Session Detection:
The script checks whether the current time falls within the overnight session:
If the hour is greater than or equal to the start hour (e.g., 17:00).
Or if the hour is less than or equal to the end hour (e.g., 09:30), considering the next day.
The end minute (e.g., 30 minutes past the hour) is also considered for precision.
High and Low Calculation:
During the overnight session:
If the overnightHigh is not yet defined, it initializes with the current candle's high.
If already defined, it updates by comparing the current candle's high to the existing overnightHigh using the math.max function.
Similarly, overnightLow is initialized or updated using the math.min function.
Post-Session Reset:
After the session ends, the script clears the overnightHigh and overnightLow variables by setting them to na (not available).
Line Drawing:
The script draws horizontal dotted lines for the Overnight High and Low during and after the session.
The lines extend indefinitely to the right of the chart.
Benefits:
Visual Aid: Helps traders quickly identify overnight support and resistance levels, which are critical for intraday trading.
Automation: Removes the need for manually plotting these levels each day.
Customizable: Time settings can be adjusted to match different markets or trading strategies.
This script is ideal for traders who use the overnight range as part of their analysis for breakouts, reversals, or trend continuation strategies.
오픈 소스 스크립트
트레이딩뷰의 진정한 정신에 따라, 이 스크립트의 작성자는 이를 오픈소스로 공개하여 트레이더들이 기능을 검토하고 검증할 수 있도록 했습니다. 작성자에게 찬사를 보냅니다! 이 코드는 무료로 사용할 수 있지만, 코드를 재게시하는 경우 하우스 룰이 적용된다는 점을 기억하세요.
면책사항
해당 정보와 게시물은 금융, 투자, 트레이딩 또는 기타 유형의 조언이나 권장 사항으로 간주되지 않으며, 트레이딩뷰에서 제공하거나 보증하는 것이 아닙니다. 자세한 내용은 이용 약관을 참조하세요.
오픈 소스 스크립트
트레이딩뷰의 진정한 정신에 따라, 이 스크립트의 작성자는 이를 오픈소스로 공개하여 트레이더들이 기능을 검토하고 검증할 수 있도록 했습니다. 작성자에게 찬사를 보냅니다! 이 코드는 무료로 사용할 수 있지만, 코드를 재게시하는 경우 하우스 룰이 적용된다는 점을 기억하세요.
면책사항
해당 정보와 게시물은 금융, 투자, 트레이딩 또는 기타 유형의 조언이나 권장 사항으로 간주되지 않으며, 트레이딩뷰에서 제공하거나 보증하는 것이 아닙니다. 자세한 내용은 이용 약관을 참조하세요.