OPEN-SOURCE SCRIPT
[EmreKb] Combined Candles

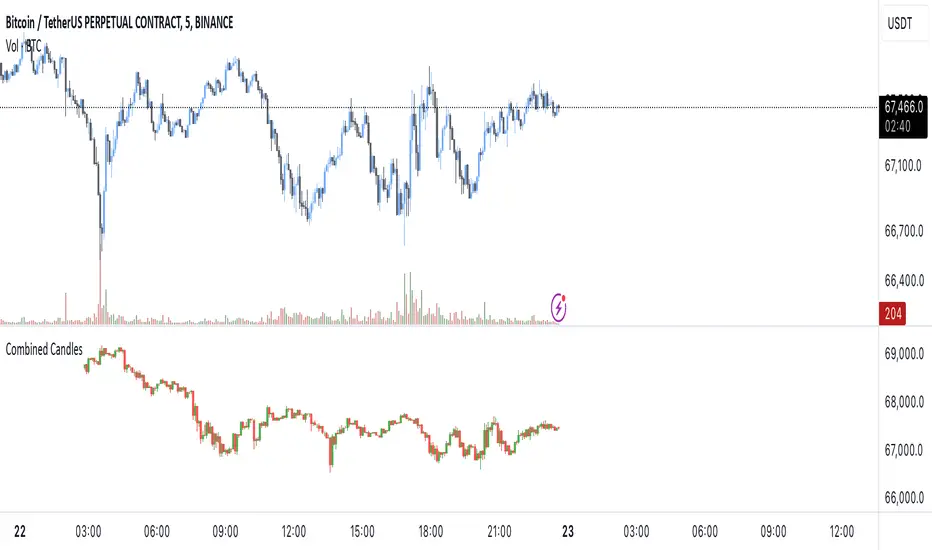
This script combines multiple candlestick patterns into a single, unified candle when they are of the same type (bullish or bearish). Instead of displaying every individual candle on the chart, it merges consecutive candles based on their direction to simplify the visual analysis of price movements.
What It Does:
How It Works:
Use Case:
This script simplifies price action by grouping similar candles together, making it easier to identify trends and spot periods of sustained buying or selling pressure. It can help traders focus on the overall direction of the market rather than being distracted by small fluctuations between individual candles.
What It Does:
- Combines Candles: If two or more consecutive candles are bullish (close price higher than open price) or bearish (close price lower than open price), the script merges them into a single candle, adjusting the high, low, and close values accordingly.
- Displays Merged Candles: The merged candles are drawn on the chart. A green bar represents a bullish period, while a red bar represents a bearish period.
How It Works:
- The script tracks whether each candle is bullish or bearish.
- If a candle is the same type as the previous one, it updates the combined candle (adjusting the high, low, and close values).
- When the type changes (from bullish to bearish or vice versa), it finalizes the current combined candle and starts a new one.
- The merged candles are displayed on the chart at the end of the data series.
Use Case:
This script simplifies price action by grouping similar candles together, making it easier to identify trends and spot periods of sustained buying or selling pressure. It can help traders focus on the overall direction of the market rather than being distracted by small fluctuations between individual candles.
오픈 소스 스크립트
트레이딩뷰의 진정한 정신에 따라, 이 스크립트의 작성자는 이를 오픈소스로 공개하여 트레이더들이 기능을 검토하고 검증할 수 있도록 했습니다. 작성자에게 찬사를 보냅니다! 이 코드는 무료로 사용할 수 있지만, 코드를 재게시하는 경우 하우스 룰이 적용된다는 점을 기억하세요.
면책사항
해당 정보와 게시물은 금융, 투자, 트레이딩 또는 기타 유형의 조언이나 권장 사항으로 간주되지 않으며, 트레이딩뷰에서 제공하거나 보증하는 것이 아닙니다. 자세한 내용은 이용 약관을 참조하세요.
오픈 소스 스크립트
트레이딩뷰의 진정한 정신에 따라, 이 스크립트의 작성자는 이를 오픈소스로 공개하여 트레이더들이 기능을 검토하고 검증할 수 있도록 했습니다. 작성자에게 찬사를 보냅니다! 이 코드는 무료로 사용할 수 있지만, 코드를 재게시하는 경우 하우스 룰이 적용된다는 점을 기억하세요.
면책사항
해당 정보와 게시물은 금융, 투자, 트레이딩 또는 기타 유형의 조언이나 권장 사항으로 간주되지 않으며, 트레이딩뷰에서 제공하거나 보증하는 것이 아닙니다. 자세한 내용은 이용 약관을 참조하세요.