OPEN-SOURCE SCRIPT
BETA (against any benchmark index - defaulted to NSE:NIFTY)
Beta value of a stock relative to benchmark index. Thanks to Ricardo Santos for the original script. This script is adapted from it.
To understand beta, refer Investopedia link: investopedia.com/terms/b/beta.asp
A beta value of 1 means the stock is directly correlated to benchmark index - volatility would be same as overall market.
Beta value less than 1 and greater than 0 means the stock is less volatile than the market.
Beta value more than 1 would mean the stock is more volatile than the market.
A beta value of 1.2 would roughly translate to the stock being 20% more volatile than the overall market.
A negative beta value indicates the stock is inversely correlated to market.
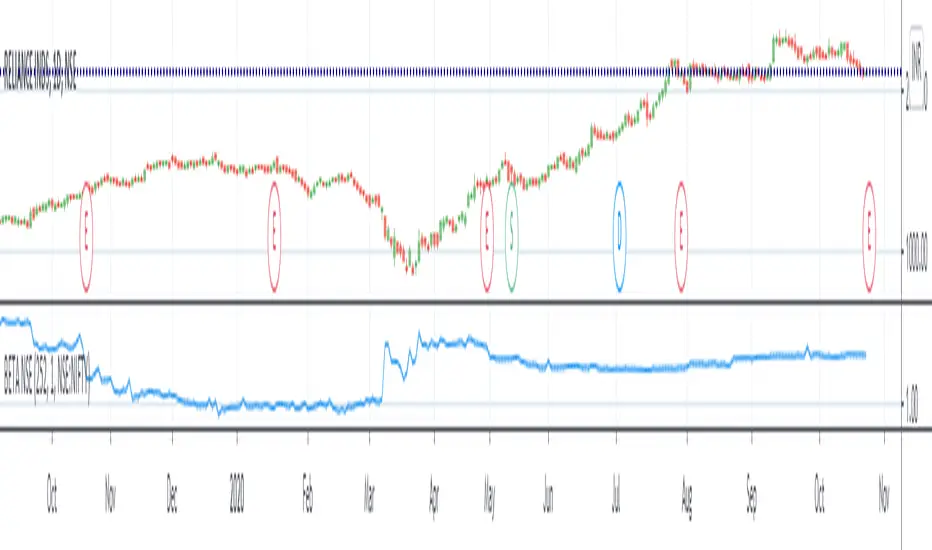
In the example chart, you can see the Beta value change in NSE:RELIANCE with respect to NSE:NIFTY.
To understand beta, refer Investopedia link: investopedia.com/terms/b/beta.asp
A beta value of 1 means the stock is directly correlated to benchmark index - volatility would be same as overall market.
Beta value less than 1 and greater than 0 means the stock is less volatile than the market.
Beta value more than 1 would mean the stock is more volatile than the market.
A beta value of 1.2 would roughly translate to the stock being 20% more volatile than the overall market.
A negative beta value indicates the stock is inversely correlated to market.
In the example chart, you can see the Beta value change in NSE:RELIANCE with respect to NSE:NIFTY.
오픈 소스 스크립트
트레이딩뷰의 진정한 정신에 따라, 이 스크립트의 작성자는 이를 오픈소스로 공개하여 트레이더들이 기능을 검토하고 검증할 수 있도록 했습니다. 작성자에게 찬사를 보냅니다! 이 코드는 무료로 사용할 수 있지만, 코드를 재게시하는 경우 하우스 룰이 적용된다는 점을 기억하세요.
면책사항
해당 정보와 게시물은 금융, 투자, 트레이딩 또는 기타 유형의 조언이나 권장 사항으로 간주되지 않으며, 트레이딩뷰에서 제공하거나 보증하는 것이 아닙니다. 자세한 내용은 이용 약관을 참조하세요.
오픈 소스 스크립트
트레이딩뷰의 진정한 정신에 따라, 이 스크립트의 작성자는 이를 오픈소스로 공개하여 트레이더들이 기능을 검토하고 검증할 수 있도록 했습니다. 작성자에게 찬사를 보냅니다! 이 코드는 무료로 사용할 수 있지만, 코드를 재게시하는 경우 하우스 룰이 적용된다는 점을 기억하세요.
면책사항
해당 정보와 게시물은 금융, 투자, 트레이딩 또는 기타 유형의 조언이나 권장 사항으로 간주되지 않으며, 트레이딩뷰에서 제공하거나 보증하는 것이 아닙니다. 자세한 내용은 이용 약관을 참조하세요.