OPEN-SOURCE SCRIPT
BBMan with EMAs
BBMan (Bollinger Bands Manager)
Created by: Hiroshi Yoshitaka
Website: cryptrader.net
Description:
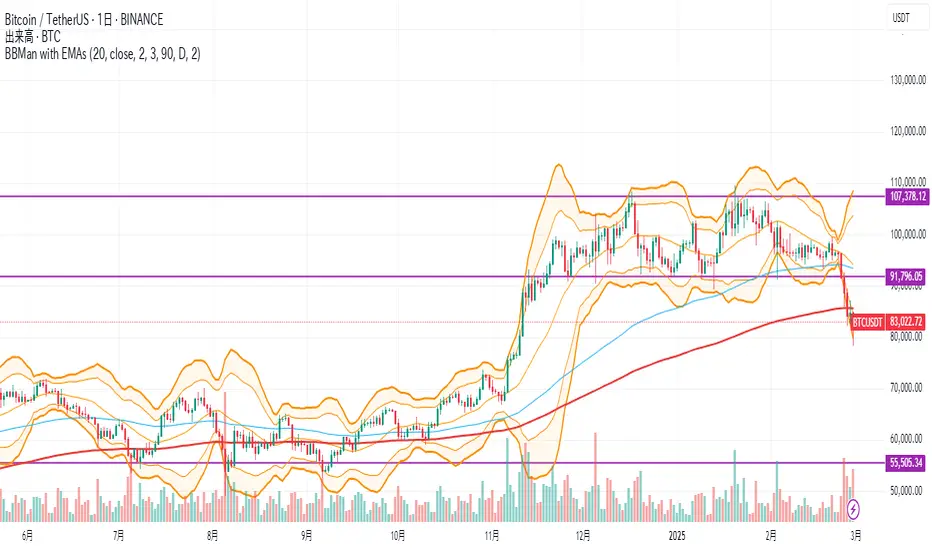
A comprehensive Bollinger Bands indicator that combines standard deviation bands (2σ and 3σ) with key EMAs (100 and 200) for enhanced technical analysis. The indicator features customizable visual elements and flexible alert conditions.
Key Features:
- Dual Bollinger Bands (2σ and 3σ)
- EMA 100 and 200 overlay
- Customizable color scheme
- Advanced alert system
Components:
1. Bollinger Bands
- Center line (20-period SMA)
- 2σ bands (thinner lines)
- 3σ bands (thicker lines)
- Highlighted area between 2σ and 3σ
2. Moving Averages
- EMA 100 (medium-term trend)
- EMA 200 (long-term trend)
- Toggle option for EMA display
3. Alert System
- Customizable timeframe selection
- Choice between 2σ and 3σ band touches
- Price touch notifications
Visual Settings:
- Orange-based color scheme for bands
- Customizable transparency for highlighted areas
- Different line weights for 2σ and 3σ bands
- Distinct colors for EMAs (blue for 100, red for 200)
Use Cases:
- Volatility analysis
- Trend identification
- Support/resistance levels
- Overbought/oversold conditions
- Price reversal signals
The indicator is designed for traders who want a clean, professional view of price action relative to standard deviation bands while maintaining awareness of key moving averages.
Created by: Hiroshi Yoshitaka
Website: cryptrader.net
Description:
A comprehensive Bollinger Bands indicator that combines standard deviation bands (2σ and 3σ) with key EMAs (100 and 200) for enhanced technical analysis. The indicator features customizable visual elements and flexible alert conditions.
Key Features:
- Dual Bollinger Bands (2σ and 3σ)
- EMA 100 and 200 overlay
- Customizable color scheme
- Advanced alert system
Components:
1. Bollinger Bands
- Center line (20-period SMA)
- 2σ bands (thinner lines)
- 3σ bands (thicker lines)
- Highlighted area between 2σ and 3σ
2. Moving Averages
- EMA 100 (medium-term trend)
- EMA 200 (long-term trend)
- Toggle option for EMA display
3. Alert System
- Customizable timeframe selection
- Choice between 2σ and 3σ band touches
- Price touch notifications
Visual Settings:
- Orange-based color scheme for bands
- Customizable transparency for highlighted areas
- Different line weights for 2σ and 3σ bands
- Distinct colors for EMAs (blue for 100, red for 200)
Use Cases:
- Volatility analysis
- Trend identification
- Support/resistance levels
- Overbought/oversold conditions
- Price reversal signals
The indicator is designed for traders who want a clean, professional view of price action relative to standard deviation bands while maintaining awareness of key moving averages.
오픈 소스 스크립트
트레이딩뷰의 진정한 정신에 따라, 이 스크립트의 작성자는 이를 오픈소스로 공개하여 트레이더들이 기능을 검토하고 검증할 수 있도록 했습니다. 작성자에게 찬사를 보냅니다! 이 코드는 무료로 사용할 수 있지만, 코드를 재게시하는 경우 하우스 룰이 적용된다는 점을 기억하세요.
면책사항
해당 정보와 게시물은 금융, 투자, 트레이딩 또는 기타 유형의 조언이나 권장 사항으로 간주되지 않으며, 트레이딩뷰에서 제공하거나 보증하는 것이 아닙니다. 자세한 내용은 이용 약관을 참조하세요.
오픈 소스 스크립트
트레이딩뷰의 진정한 정신에 따라, 이 스크립트의 작성자는 이를 오픈소스로 공개하여 트레이더들이 기능을 검토하고 검증할 수 있도록 했습니다. 작성자에게 찬사를 보냅니다! 이 코드는 무료로 사용할 수 있지만, 코드를 재게시하는 경우 하우스 룰이 적용된다는 점을 기억하세요.
면책사항
해당 정보와 게시물은 금융, 투자, 트레이딩 또는 기타 유형의 조언이나 권장 사항으로 간주되지 않으며, 트레이딩뷰에서 제공하거나 보증하는 것이 아닙니다. 자세한 내용은 이용 약관을 참조하세요.