PROTECTED SOURCE SCRIPT
업데이트됨 Bitcoin SOPR Heatmap
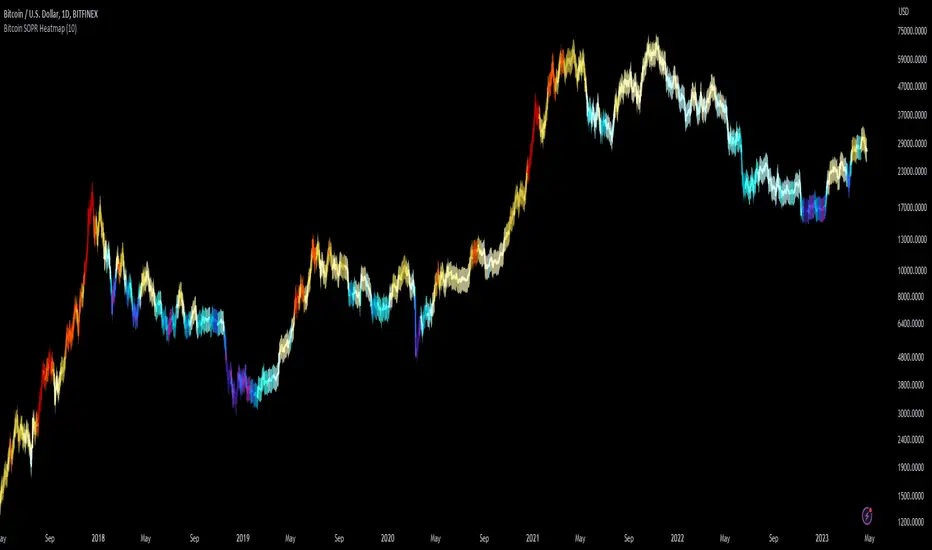
SOPR (spent output profit ratio) is a metric, provided by Glassnode to measure if most BTC are moved in profit or in loss. The higher SOPR is, the more profits are realized (theoretically) and vice versa.
This indicator shows SOPR visually as a heatmap directly on the Bitcoin chart.
Cold temperatures (blue, purple) show bear markets. Bear market peaks should be visible in dark purple.
Hot temperatues (yellow, red) show bull markets. Hype phases should be visible in red.
I recommend to hide chart when using the indicator. Otherwise you can also enlarge the heatmap in the settings.
The indicator works best on BTCUSD standard charts on daily timeframe. Otherwise you will see an error message.
릴리즈 노트
- Code error fixed
보호된 스크립트입니다
이 스크립트는 비공개 소스로 게시됩니다. 하지만 이를 자유롭게 제한 없이 사용할 수 있습니다 – 자세한 내용은 여기에서 확인하세요.
We build Bitcoin and crypto algorithms with the intention to outperform.
Check out our website to see more of our work.
Check out our website to see more of our work.
면책사항
해당 정보와 게시물은 금융, 투자, 트레이딩 또는 기타 유형의 조언이나 권장 사항으로 간주되지 않으며, 트레이딩뷰에서 제공하거나 보증하는 것이 아닙니다. 자세한 내용은 이용 약관을 참조하세요.