INVITE-ONLY SCRIPT
업데이트됨 Autonomous LSTM Stop-Loss
Structure
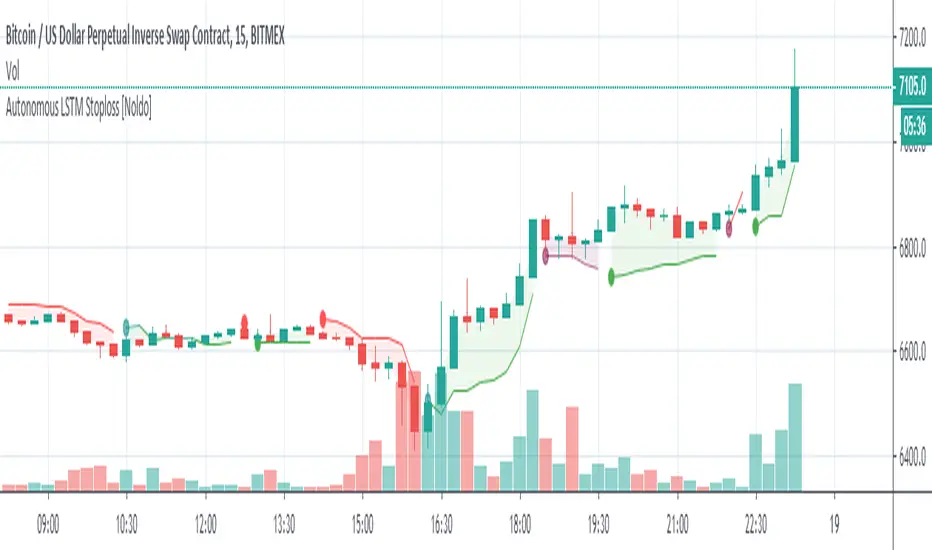
Autonomous LSTM Stop-Loss is a stop-loss technique that uses the Autonomous LSTM algorithm.
For detailed info about Autonomous LSTM :
![Autonomous LSTM [Noldo]](https://s3.tradingview.com/e/ExPy48mQ_mid.png)
*** Features

*** Settings :
*** Usage
The Stop-Loss indicator can slide on the chart.
So you have to make sure you put it in place.
Since this is a region scan from the OHLC levels, indicator contains small blue dots to the ohlc levels and made it serve as a guide.
However, since we cannot know the OHLC values precisely, it is best to use them as follows:
Because it is often forgotten to put it in place:
(OHLC : Average of Open, High, Low, and Closing prices for each period)

NOTE :
Some structures (Market Adaptive Stop-Loss) and design in this script are inspired by everget's Chandelier Exit script :

Best regards.
Autonomous LSTM Stop-Loss is a stop-loss technique that uses the Autonomous LSTM algorithm.
For detailed info about Autonomous LSTM :
*** Features
- This structure is different from standard stop-losses.
The base frame is based on "Market Adaptive Stop-Loss" script.
For detailed information about Market Adaptive Stop-Loss:
- This script uses the Autonomous LSTM as cross method.
- Tradeable / Non Tradeable Region Detector :
This script separates tradeable and non-tradeable regions with a coloring method.
Plotting Rules :
* Maroon : Uncorfirmed Short Positions
* Teal : Unconfirmed Long Positions
* Green : Confirmed Long Positions
* Red : Confirmed Short Positions
- This script can be used in all time frames.
- Does not repaint. ( Source = close )
*** Settings :
- The only option here is the ATR multiplier.
The default use value of this ATR multiplier, which is of the standard of stop-loss, is 2.You can set it from the menu.
- No alert is set.
Because the positive and negative regions are the same as Autonomous LSTM.
Since the traders can trade according to the support and resistance outside the definite regions, the unnecessary signal was confused and the alerts were removed.
*** Usage
The Stop-Loss indicator can slide on the chart.
So you have to make sure you put it in place.
Since this is a region scan from the OHLC levels, indicator contains small blue dots to the ohlc levels and made it serve as a guide.
However, since we cannot know the OHLC values precisely, it is best to use them as follows:
Because it is often forgotten to put it in place:
(OHLC : Average of Open, High, Low, and Closing prices for each period)
- Using this script in a new pane below will radically solve slip problems.
Stop-Loss values do not slip definitely.The values are selected from the alignment.
NOTE :
Some structures (Market Adaptive Stop-Loss) and design in this script are inspired by everget's Chandelier Exit script :
Best regards.
릴리즈 노트
Slide on chart problems solved . Thanks syrinxflunki to his suggestion . 초대 전용 스크립트
이 스크립트는 작성자가 승인한 사용자만 접근할 수 있습니다. 사용하려면 요청 후 승인을 받아야 하며, 일반적으로 결제 후에 허가가 부여됩니다. 자세한 내용은 아래 작성자의 안내를 따르거나 Noldo에게 직접 문의하세요.
트레이딩뷰는 스크립트의 작동 방식을 충분히 이해하고 작성자를 완전히 신뢰하지 않는 이상, 해당 스크립트에 비용을 지불하거나 사용하는 것을 권장하지 않습니다. 커뮤니티 스크립트에서 무료 오픈소스 대안을 찾아보실 수도 있습니다.
작성자 지시 사항
Signals will be broadcast openly for a reasonable period.
Let's watch the algorithm's movements together from my website !
bit.ly/4j4sANJ
Email : contact@noldoresearch.com
Let's watch the algorithm's movements together from my website !
bit.ly/4j4sANJ
Email : contact@noldoresearch.com
면책사항
해당 정보와 게시물은 금융, 투자, 트레이딩 또는 기타 유형의 조언이나 권장 사항으로 간주되지 않으며, 트레이딩뷰에서 제공하거나 보증하는 것이 아닙니다. 자세한 내용은 이용 약관을 참조하세요.
초대 전용 스크립트
이 스크립트는 작성자가 승인한 사용자만 접근할 수 있습니다. 사용하려면 요청 후 승인을 받아야 하며, 일반적으로 결제 후에 허가가 부여됩니다. 자세한 내용은 아래 작성자의 안내를 따르거나 Noldo에게 직접 문의하세요.
트레이딩뷰는 스크립트의 작동 방식을 충분히 이해하고 작성자를 완전히 신뢰하지 않는 이상, 해당 스크립트에 비용을 지불하거나 사용하는 것을 권장하지 않습니다. 커뮤니티 스크립트에서 무료 오픈소스 대안을 찾아보실 수도 있습니다.
작성자 지시 사항
Signals will be broadcast openly for a reasonable period.
Let's watch the algorithm's movements together from my website !
bit.ly/4j4sANJ
Email : contact@noldoresearch.com
Let's watch the algorithm's movements together from my website !
bit.ly/4j4sANJ
Email : contact@noldoresearch.com
면책사항
해당 정보와 게시물은 금융, 투자, 트레이딩 또는 기타 유형의 조언이나 권장 사항으로 간주되지 않으며, 트레이딩뷰에서 제공하거나 보증하는 것이 아닙니다. 자세한 내용은 이용 약관을 참조하세요.