PROTECTED SOURCE SCRIPT
Long and Short Signal_1hours [zavaUnni]
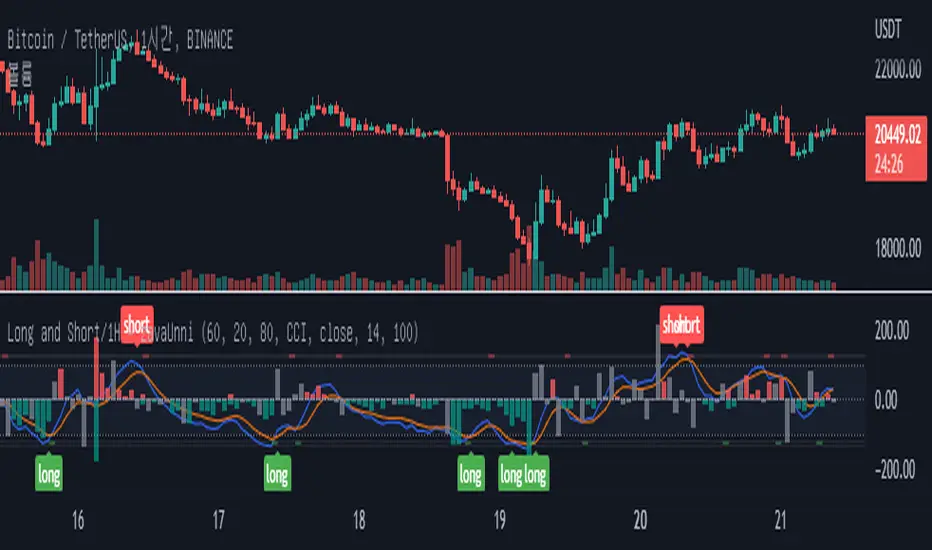
This indicator is available in the 1 hour chart.
The Stochastic value of 1 hour of 3 types of length was requested, summed, and then the value was derived.
The blue line is the K and the orange line is D of the Stochastic.
The default is Stochastic, but when RSI is selected in the settings, it can be viewed as the relative strength index of the Stochastic.


[Signal]
If the K value crosses down at 100, a short signal is generated
Cross up below -100 and you'll get a long signal.
You can receive a ready signal by checking Position Ready in Settings.
Short ready signal when the k line goes up to 100.
Long ready signal when the k line goes below -100.

[Histogram]
A small spread value of the candle relative to the volume is the principle that resistance has occurred.
Displayed the resistance value based on the average value of the last 100 candles.
The higher the value of the red Histogram, the stronger the selling.
The lower the value of the green Histogram value, the stronger the buying .
The gray histogram is when there's no buying or selling pressure.
The Stochastic value of 1 hour of 3 types of length was requested, summed, and then the value was derived.
The blue line is the K and the orange line is D of the Stochastic.
The default is Stochastic, but when RSI is selected in the settings, it can be viewed as the relative strength index of the Stochastic.
[Signal]
If the K value crosses down at 100, a short signal is generated
Cross up below -100 and you'll get a long signal.
You can receive a ready signal by checking Position Ready in Settings.
Short ready signal when the k line goes up to 100.
Long ready signal when the k line goes below -100.
[Histogram]
A small spread value of the candle relative to the volume is the principle that resistance has occurred.
Displayed the resistance value based on the average value of the last 100 candles.
The higher the value of the red Histogram, the stronger the selling.
The lower the value of the green Histogram value, the stronger the buying .
The gray histogram is when there's no buying or selling pressure.
보호된 스크립트입니다
이 스크립트는 비공개 소스로 게시됩니다. 하지만 이를 자유롭게 제한 없이 사용할 수 있습니다 – 자세한 내용은 여기에서 확인하세요.
면책사항
해당 정보와 게시물은 금융, 투자, 트레이딩 또는 기타 유형의 조언이나 권장 사항으로 간주되지 않으며, 트레이딩뷰에서 제공하거나 보증하는 것이 아닙니다. 자세한 내용은 이용 약관을 참조하세요.
면책사항
해당 정보와 게시물은 금융, 투자, 트레이딩 또는 기타 유형의 조언이나 권장 사항으로 간주되지 않으며, 트레이딩뷰에서 제공하거나 보증하는 것이 아닙니다. 자세한 내용은 이용 약관을 참조하세요.