OPEN-SOURCE SCRIPT
업데이트됨 R3 ETF Strategy
This strategy is a modification of the “R3 Strategy” from the book "High Probability ETF Trading" by Larry Connors and Cesar Alvarez. This RSI strategy is for a 1-day time-frame and has these 3 simple rules:
Criteria:
How it works:
The Strategy will buy when the buy conditions above are true. The strategy will sell when the RSI crosses above 70. The RSI period/length, and RSI entry/exit criteria thresholds have all been coded to be adjustable with inputs.
Plots:
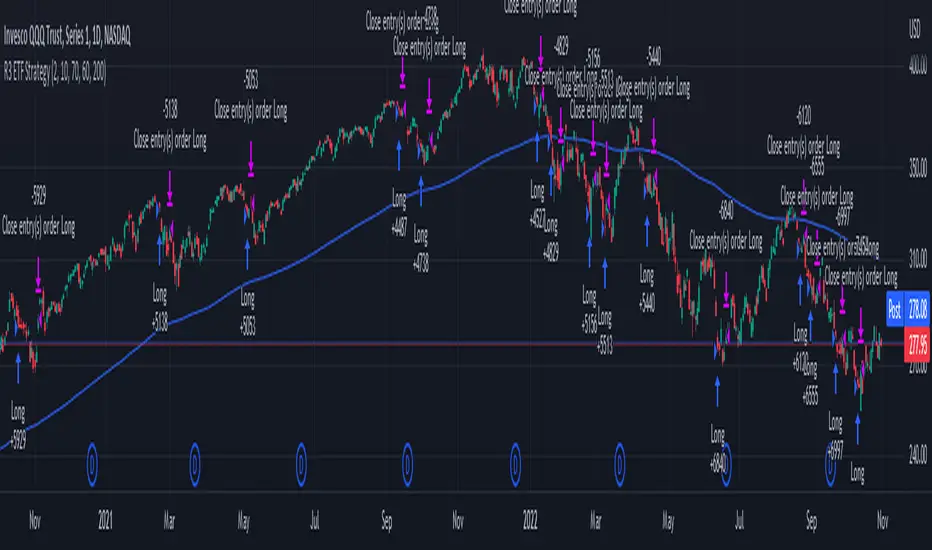
Blue line = 200 Day EMA (Used as Entry Criteria)
Disclaimer: Open-source scripts I publish in the community are largely meant to spark ideas that can be used as building blocks for part of a more robust trade management strategy. If you would like to implement a version of any script, I would recommend making significant additions/modifications to the strategy & risk management functions. If you don’t know how to program in Pine, then hire a Pine-coder. We can help!
Criteria:
- The price must be above the 200 day moving average.
- The 2-period (day) RSI drops 3 days in a row.
- The 2-period RSI must have been below 60 3 days ago and below 10 today.
Entry and Exit: - If the 3 rules above are true, then buy on the close of the current day.
- Exit on the day's close when the RSI crosses above 70.
How it works:
The Strategy will buy when the buy conditions above are true. The strategy will sell when the RSI crosses above 70. The RSI period/length, and RSI entry/exit criteria thresholds have all been coded to be adjustable with inputs.
Plots:
Blue line = 200 Day EMA (Used as Entry Criteria)
Disclaimer: Open-source scripts I publish in the community are largely meant to spark ideas that can be used as building blocks for part of a more robust trade management strategy. If you would like to implement a version of any script, I would recommend making significant additions/modifications to the strategy & risk management functions. If you don’t know how to program in Pine, then hire a Pine-coder. We can help!
릴리즈 노트
This strategy is up over 15% YTD going long on QQQ and SPY through some rather adverse market conditions. The original version was hard coded to only trade when the market is above the 200 day EMA. While backtesting index ETFs, I've found multiple instances where someone might not want to have trades filtered out below that trend. So, this new version adds an input that allows the user to select whether or not to enter trades when the market is below the 200 day EMA. The change improved backtest and YTD performance on SPY and QQQ. Cheers! 오픈 소스 스크립트
트레이딩뷰의 진정한 정신에 따라, 이 스크립트의 작성자는 이를 오픈소스로 공개하여 트레이더들이 기능을 검토하고 검증할 수 있도록 했습니다. 작성자에게 찬사를 보냅니다! 이 코드는 무료로 사용할 수 있지만, 코드를 재게시하는 경우 하우스 룰이 적용된다는 점을 기억하세요.
Want to build custom alerts and custom strategies? Interested in automated trading?
Hire me to code or automate your trading strategy, or schedule a free consultation at:
TradeAutomation.net
Hire me to code or automate your trading strategy, or schedule a free consultation at:
TradeAutomation.net
면책사항
해당 정보와 게시물은 금융, 투자, 트레이딩 또는 기타 유형의 조언이나 권장 사항으로 간주되지 않으며, 트레이딩뷰에서 제공하거나 보증하는 것이 아닙니다. 자세한 내용은 이용 약관을 참조하세요.
오픈 소스 스크립트
트레이딩뷰의 진정한 정신에 따라, 이 스크립트의 작성자는 이를 오픈소스로 공개하여 트레이더들이 기능을 검토하고 검증할 수 있도록 했습니다. 작성자에게 찬사를 보냅니다! 이 코드는 무료로 사용할 수 있지만, 코드를 재게시하는 경우 하우스 룰이 적용된다는 점을 기억하세요.
Want to build custom alerts and custom strategies? Interested in automated trading?
Hire me to code or automate your trading strategy, or schedule a free consultation at:
TradeAutomation.net
Hire me to code or automate your trading strategy, or schedule a free consultation at:
TradeAutomation.net
면책사항
해당 정보와 게시물은 금융, 투자, 트레이딩 또는 기타 유형의 조언이나 권장 사항으로 간주되지 않으며, 트레이딩뷰에서 제공하거나 보증하는 것이 아닙니다. 자세한 내용은 이용 약관을 참조하세요.