PROTECTED SOURCE SCRIPT
업데이트됨 Wave Momentum Indicator
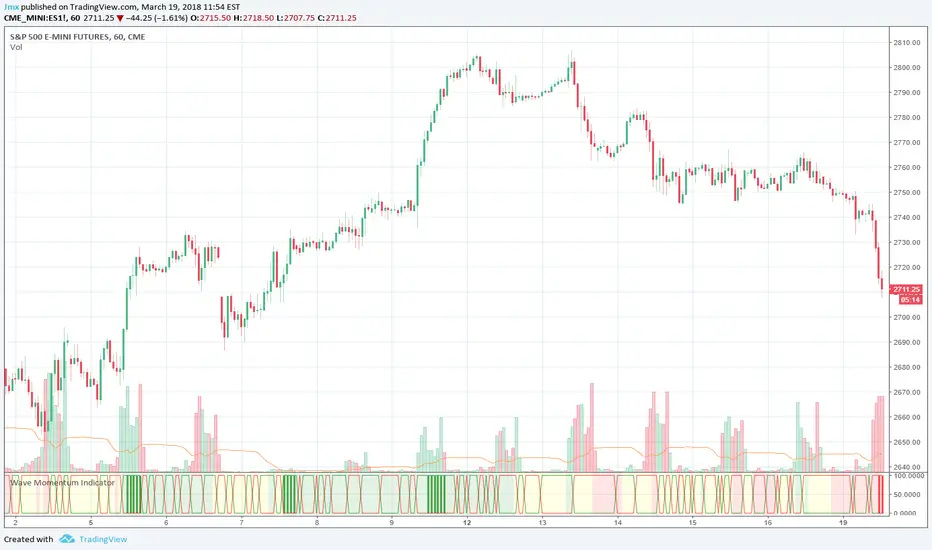
The Wave Momentum Indicator combines elements of Weiss Wave, Hilbert Sine Wave, and a trend analysis calculation to present trending and high probability entries.
Green and red horizontal lines indicate directional volume
Background color indicates whether trading trend is bullish , bearish , or choppy (related to price expansion in a given direction)
Green / Red vertical lines indicate potential entries during a session when trend has been established for a period (building volume and entering a bullish/bearish zone) and are only their for example and not trading advice.
At a glance, when you see green verticals it's a confirmation of a bullish trend while red verticals are a confirmation of a bearish trend.
Simple usage:
Enter bullish on green vertical/background, exit on chop zone (yellow) or when bullish volume ends.
There are built in alerts for the bullish and bearish entry conditions to make alerting easier.
This indicator was designed for trading choppy sessions of the SPX via ES1! (E-Mini Futures ). Works best on the 15m and 1hr time-frames.
릴리즈 노트
* Fixed a timing issue in the code which was causing in-session bull/bear triggers to trigger late at certain time-frames (lower)* Proper labels for plots to assist in alert making or strategy writing
* Re-wrote the session logic as follows:
- Green Vertical: BUY Wave while in-session but after Whipsaw zone (0930-100)
- Red Vertical: SELL Wave while in-session but after whipsaw zone (0930-1000)
- Blue Vertical: BUY wave developing any other time
- Orange Vertical: Sell wave developing any other time
Updated the alerts and plots to reflect these new states so they can be properly alerted independently.
릴리즈 노트
Updated backdrop coloring and chart보호된 스크립트입니다
이 스크립트는 비공개 소스로 게시됩니다. 하지만 이를 자유롭게 제한 없이 사용할 수 있습니다 – 자세한 내용은 여기에서 확인하세요.
면책사항
해당 정보와 게시물은 금융, 투자, 트레이딩 또는 기타 유형의 조언이나 권장 사항으로 간주되지 않으며, 트레이딩뷰에서 제공하거나 보증하는 것이 아닙니다. 자세한 내용은 이용 약관을 참조하세요.
면책사항
해당 정보와 게시물은 금융, 투자, 트레이딩 또는 기타 유형의 조언이나 권장 사항으로 간주되지 않으며, 트레이딩뷰에서 제공하거나 보증하는 것이 아닙니다. 자세한 내용은 이용 약관을 참조하세요.