OPEN-SOURCE SCRIPT
MTF Stochastic RSI w/ Zones
MTF Stochastic RSI w/ Zones by // © KaizenTraderB
I revamped my original Stochastic RSI Band indicator with more accurate algorithms, cleaner coding and more adjustable options.
I will be soon releasing a variation of this indicator that prints over price chart with key candle indicators
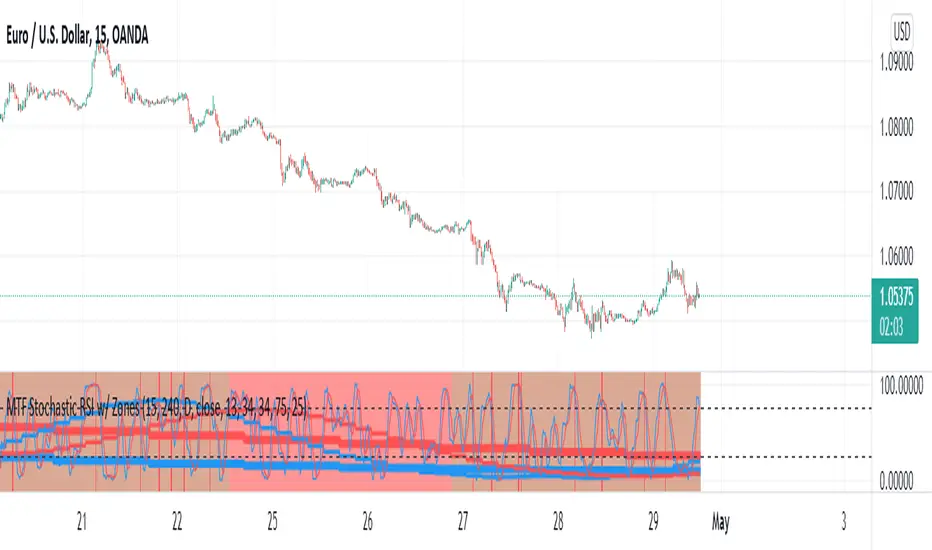
This indicator will display the Stochastic RSI in 3 Timeframes of your choice.
It will also display color zones. When the higher timeframe is bullish it will be green and when bullish, red.
When the middle timeframe is counter the higher, it will appear brownish.
The entry timeframe will print red and green lines at bullish and bearish Stochastic RSI crossovers when oversold and overbought, respectively,
In the direction of the higher timeframe directional bias when the middle timeframe is counter that direction to catch reversals in corrections.
The options allow you to turn the lines and zones on and off, as well as which Timeframes you choose to view.
Entry - 1Hr, 15m, 5m Middle Timeframe - 1Hr, 4Hr, Daily Higher Timeframe - 4Hr, Daily, Weekly or Monthly
You can also change the parameters of the Stochastic RSI for each of the three timeframes:
When 8 is chosen for RSI Length, Stochastic Length - 5, SmoothK - 3, Smooth D - 3 For 13 - 8, 5, 5 For 21 - 13, 8, 8 For 34 - 21, 13, 13
Its good practice to adjust settings so Higher Timeframe zones (green/red) correlate with longer trend movements,
Medium Timeframe with corrections and reversal areas (brown) and Entry Timeframe with key reversal candles.
Look at chart for last 200 bars or so and find the settings that correlate with recent past price action and adjust accordingly.
Its also good practice to have the chart timeframe correlate with entry timeframe of indicator.
You can also adjust overbought and oversold areas.
Coding included to prevent repainting
Message me with feedback to improve upon this indicator or requested additions.
I revamped my original Stochastic RSI Band indicator with more accurate algorithms, cleaner coding and more adjustable options.
I will be soon releasing a variation of this indicator that prints over price chart with key candle indicators
This indicator will display the Stochastic RSI in 3 Timeframes of your choice.
It will also display color zones. When the higher timeframe is bullish it will be green and when bullish, red.
When the middle timeframe is counter the higher, it will appear brownish.
The entry timeframe will print red and green lines at bullish and bearish Stochastic RSI crossovers when oversold and overbought, respectively,
In the direction of the higher timeframe directional bias when the middle timeframe is counter that direction to catch reversals in corrections.
The options allow you to turn the lines and zones on and off, as well as which Timeframes you choose to view.
Entry - 1Hr, 15m, 5m Middle Timeframe - 1Hr, 4Hr, Daily Higher Timeframe - 4Hr, Daily, Weekly or Monthly
You can also change the parameters of the Stochastic RSI for each of the three timeframes:
When 8 is chosen for RSI Length, Stochastic Length - 5, SmoothK - 3, Smooth D - 3 For 13 - 8, 5, 5 For 21 - 13, 8, 8 For 34 - 21, 13, 13
Its good practice to adjust settings so Higher Timeframe zones (green/red) correlate with longer trend movements,
Medium Timeframe with corrections and reversal areas (brown) and Entry Timeframe with key reversal candles.
Look at chart for last 200 bars or so and find the settings that correlate with recent past price action and adjust accordingly.
Its also good practice to have the chart timeframe correlate with entry timeframe of indicator.
You can also adjust overbought and oversold areas.
Coding included to prevent repainting
Message me with feedback to improve upon this indicator or requested additions.
오픈 소스 스크립트
트레이딩뷰의 진정한 정신에 따라, 이 스크립트의 작성자는 이를 오픈소스로 공개하여 트레이더들이 기능을 검토하고 검증할 수 있도록 했습니다. 작성자에게 찬사를 보냅니다! 이 코드는 무료로 사용할 수 있지만, 코드를 재게시하는 경우 하우스 룰이 적용된다는 점을 기억하세요.
면책사항
해당 정보와 게시물은 금융, 투자, 트레이딩 또는 기타 유형의 조언이나 권장 사항으로 간주되지 않으며, 트레이딩뷰에서 제공하거나 보증하는 것이 아닙니다. 자세한 내용은 이용 약관을 참조하세요.
오픈 소스 스크립트
트레이딩뷰의 진정한 정신에 따라, 이 스크립트의 작성자는 이를 오픈소스로 공개하여 트레이더들이 기능을 검토하고 검증할 수 있도록 했습니다. 작성자에게 찬사를 보냅니다! 이 코드는 무료로 사용할 수 있지만, 코드를 재게시하는 경우 하우스 룰이 적용된다는 점을 기억하세요.
면책사항
해당 정보와 게시물은 금융, 투자, 트레이딩 또는 기타 유형의 조언이나 권장 사항으로 간주되지 않으며, 트레이딩뷰에서 제공하거나 보증하는 것이 아닙니다. 자세한 내용은 이용 약관을 참조하세요.