PROTECTED SOURCE SCRIPT
업데이트됨 Rejection Zones with FVG Confirmation
Overview
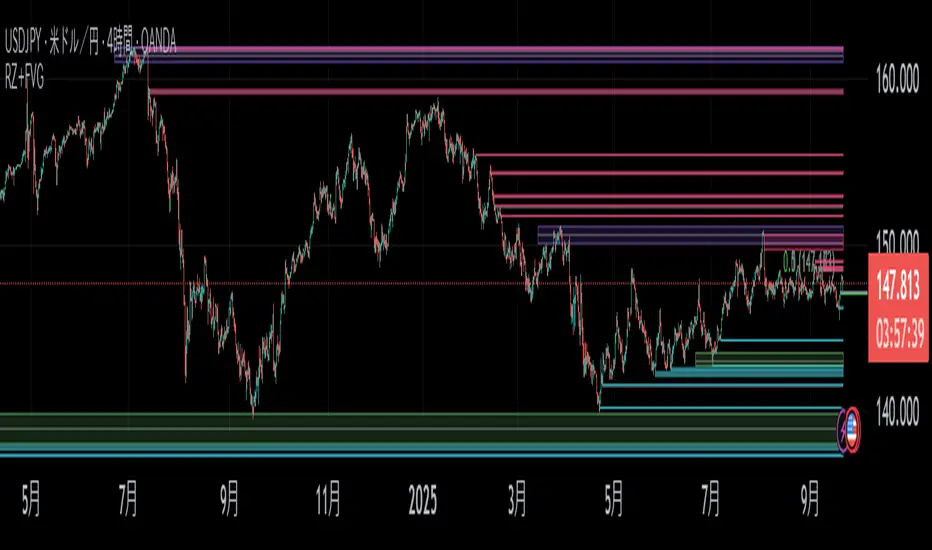
This indicator is designed to identify high-probability Rejection Zones by detecting a specific and powerful price action pattern. The core logic combines the concepts of price rejection, indicated by overlapping wicks, with a Fair Value Gap (FVG) that confirms a strong market imbalance.
These zones are automatically drawn on your chart and can serve as critical levels of potential support (demand) or resistance (supply) for future price movements. The indicator is fully equipped with multi-timeframe (MTF) capabilities, advanced zone management, and customizable alerts to enhance your trading analysis.
Key Features
How The Logic Works
A Rejection Zone is identified based on a sequence of candlestick patterns:
How to Use
Settings Explained
Higher Timeframe
Rejection Zone
Calculate Range
Alert Rejection Zone
Set your desired alert conditions here. You can enable alerts for zone creation and/or when price touches a zone, for both CTF and HTF separately.
---
Disclaimer: This indicator is for educational and analytical purposes only. It is not financial advice. Always conduct your own research and backtesting before making any trading decisions.
This indicator is designed to identify high-probability Rejection Zones by detecting a specific and powerful price action pattern. The core logic combines the concepts of price rejection, indicated by overlapping wicks, with a Fair Value Gap (FVG) that confirms a strong market imbalance.
These zones are automatically drawn on your chart and can serve as critical levels of potential support (demand) or resistance (supply) for future price movements. The indicator is fully equipped with multi-timeframe (MTF) capabilities, advanced zone management, and customizable alerts to enhance your trading analysis.
Key Features
- Dual Timeframe Analysis: Simultaneously displays Rejection Zones from your current timeframe (CTF) and a selected higher timeframe (HTF). HTF zones often represent more significant price levels.
- Advanced Zone Management: Zones are dynamically tracked and their status updates as price interacts with them (e.g., Touch, Covered). You can define conditions for when a zone should be considered invalid.
- Smart Overlap Handling: Choose how to handle overlapping zones. Either Replace the old zone with the new one or Keep Both to see all areas of interest.
- Performance Optimization: Includes an option to Calculate on Visible Range Only, which significantly improves script performance on charts with extensive historical data.
- Customizable Alerts: Set up alerts for when a new Rejection Zone is created or when price touches an existing zone, for both CTF and HTF.
- Full Visual Customization: Easily customize the colors of Bullish and Bearish zones for both timeframes to match your chart's theme.
How The Logic Works
A Rejection Zone is identified based on a sequence of candlestick patterns:
- Bullish Rejection Zone (Potential Demand):
- Imbalance Confirmation: A bullish Fair Value Gap (FVG) is detected, meaning the high of the candle two bars ago (high[2]) is lower than the current candle's low (low[0]).
- Price Rejection: The script then checks if the lower wicks of the two candles preceding the FVG (bar[2] and bar[3]) overlap. This overlap signifies a concentrated area where price was aggressively rejected.
- Zone Creation: If both conditions are met, a Bullish Rejection Zone is drawn covering the area of the combined rejection wicks. - Bearish Rejection Zone (Potential Supply):
[**] Imbalance Confirmation: A bearish FVG is detected (the low of bar[2] is higher than the current high[0]).
[**] Price Rejection: The script checks for overlapping upper wicks on bar[2] and bar[3].
Zone Creation: A Bearish Rejection Zone is drawn on the area of the combined upper wicks.
How to Use
- Identify Key Levels: Use these zones as you would with traditional support/resistance or supply/demand zones. They represent areas where a significant market reaction previously occurred.
- Entry Triggers: Look for price to return to a zone and show signs of reaction (e.g., reversal candlestick patterns, shift in market structure on a lower timeframe) before considering an entry.
- Higher Timeframe Confluence: Pay close attention to the HTF zones. A reaction from an HTF zone is generally more significant than one from a CTF zone. When a CTF zone forms within an HTF zone, it can signal a very high-probability setup.
Settings Explained
Higher Timeframe
- Show: Toggles the visibility of HTF zones.
- Timeframe Mapping (e.g., 30Sec:, 1Min:): Choose which higher timeframe to display based on your current timeframe.
Rejection Zone
- Show: Toggles the visibility of all zones.
- History: Sets the maximum number of recent zones to display on the chart.
- Size Half: If checked, reduces the vertical size of the zone by 50%, drawing it from the wick's midpoint to its tip. This can help pinpoint more precise entry levels.
- Invalidation Condition: Defines when a zone should be considered invalid and stop being monitored.
- None: Never invalidates.
- Touch: Invalidates when price touches the zone.
- Left: Invalidates after price touches and then leaves the zone.
- Covered: Invalidates when price moves completely through the zone.
- Passed: Invalidates when price has clearly passed the zone. - Do (for Invalidation): Action to take when a zone is invalidated. Remove will delete it from the chart; Nothing will just stop tracking it.
- Overlap Action:
- Replace: If a new zone overlaps an old one, the old one is removed.
- Keep Both: Allows new and old zones to overlap on the chart. - Color Settings (CTF/HTF): Full control over the border, background, and center-line colors for Bullish and Bearish zones.
Calculate Range
- Calculate on Visible Range Only:
- IMPORTANT: Check this to improve performance. The script will only process visible bars.
- NOTE: Enabling this option will disable all alerts, as alerts require the script to process all historical data.
Alert Rejection Zone
Set your desired alert conditions here. You can enable alerts for zone creation and/or when price touches a zone, for both CTF and HTF separately.
---
Disclaimer: This indicator is for educational and analytical purposes only. It is not financial advice. Always conduct your own research and backtesting before making any trading decisions.
릴리즈 노트
OverviewThis indicator is designed to identify high-probability Rejection Zones by detecting a specific and powerful price action pattern. The core logic combines the concepts of price rejection, indicated by overlapping wicks, with a Fair Value Gap (FVG) that confirms a strong market imbalance.
These zones are automatically drawn on your chart and can serve as critical levels of potential support (demand) or resistance (supply) for future price movements. The indicator is fully equipped with multi-timeframe (MTF) capabilities, advanced zone management, and customizable alerts to enhance your trading analysis.
Key Features
- Dual Timeframe Analysis: Simultaneously displays Rejection Zones from your current timeframe (CTF) and a selected higher timeframe (HTF). HTF zones often represent more significant price levels.
- Advanced Zone Management: Zones are dynamically tracked and their status updates as price interacts with them (e.g., Touch, Covered). You can define conditions for when a zone should be considered invalid.
- Smart Overlap Handling: Choose how to handle overlapping zones. Either Replace the old zone with the new one or Keep Both to see all areas of interest.
- Performance Optimization: Includes an option to Calculate on Visible Range Only, which significantly improves script performance on charts with extensive historical data.
- Customizable Alerts: Set up alerts for when a new Rejection Zone is created or when price touches an existing zone, for both CTF and HTF.
- Full Visual Customization: Easily customize the colors of Bullish and Bearish zones for both timeframes to match your chart's theme.
How The Logic Works
A Rejection Zone is identified based on a sequence of candlestick patterns:
- Bullish Rejection Zone (Potential Demand):
- Imbalance Confirmation: A bullish Fair Value Gap (FVG) is detected, meaning the high of the candle two bars ago (high[2]) is lower than the current candle's low (low[0]).
- Price Rejection: The script then checks if the lower wicks of the two candles preceding the FVG (bar[2] and bar[3]) overlap. This overlap signifies a concentrated area where price was aggressively rejected.
- Zone Creation: If both conditions are met, a Bullish Rejection Zone is drawn covering the area of the combined rejection wicks. - Bearish Rejection Zone (Potential Supply):
- Imbalance Confirmation: A bearish FVG is detected (the low of bar[2] is higher than the current high[0]).
- Price Rejection: The script checks for overlapping upper wicks on bar[2] and bar[3].
- Zone Creation: A Bearish Rejection Zone is drawn on the area of the combined upper wicks.
How to Use
- Identify Key Levels: Use these zones as you would with traditional support/resistance or supply/demand zones. They represent areas where a significant market reaction previously occurred.
- Entry Triggers: Look for price to return to a zone and show signs of reaction (e.g., reversal candlestick patterns, shift in market structure on a lower timeframe) before considering an entry.
- Higher Timeframe Confluence: Pay close attention to the HTF zones. A reaction from an HTF zone is generally more significant than one from a CTF zone. When a CTF zone forms within an HTF zone, it can signal a very high-probability setup.
Settings Explained
Higher Timeframe
- Show: Toggles the visibility of HTF zones.
- Timeframe Mapping (e.g., 30Sec:, 1Min:): Choose which higher timeframe to display based on your current timeframe.
Rejection Zone
- Show: Toggles the visibility of all zones.
- History: Sets the maximum number of recent zones to display on the chart.
- Size Half: If checked, reduces the vertical size of the zone by 50%, drawing it from the wick's midpoint to its tip. This can help pinpoint more precise entry levels.
- Invalidation Condition: Defines when a zone should be considered invalid and stop being monitored.
- None: Never invalidates.
- Touch: Invalidates when price touches the zone.
- Left: Invalidates after price touches and then leaves the zone.
- Covered: Invalidates when price moves completely through the zone.
- Passed: Invalidates when price has clearly passed the zone. - Do (for Invalidation): Action to take when a zone is invalidated. Remove will delete it from the chart; Nothing will just stop tracking it.
- Overlap Action:
- Replace: If a new zone overlaps an old one, the old one is removed.
- Keep Both: Allows new and old zones to overlap on the chart. - Color Settings (CTF/HTF): Full control over the border, background, and center-line colors for Bullish and Bearish zones.
- Calculate Range
- Calculate on Visible Range Only:
- IMPORTANT: Check this to improve performance. The script will only process visible bars.
- NOTE: Enabling this option will disable all alerts, as alerts require the script to process all historical data. - Alert Rejection Zone
Set your desired alert conditions here. You can enable alerts for zone creation and/or when price touches a zone, for both CTF and HTF separately.
---
Disclaimer: This indicator is for educational and analytical purposes only. It is not financial advice. Always conduct your own research and backtesting before making any trading decisions.
보호된 스크립트입니다
이 스크립트는 비공개 소스로 게시됩니다. 하지만 이를 자유롭게 제한 없이 사용할 수 있습니다 – 자세한 내용은 여기에서 확인하세요.
면책사항
해당 정보와 게시물은 금융, 투자, 트레이딩 또는 기타 유형의 조언이나 권장 사항으로 간주되지 않으며, 트레이딩뷰에서 제공하거나 보증하는 것이 아닙니다. 자세한 내용은 이용 약관을 참조하세요.
면책사항
해당 정보와 게시물은 금융, 투자, 트레이딩 또는 기타 유형의 조언이나 권장 사항으로 간주되지 않으며, 트레이딩뷰에서 제공하거나 보증하는 것이 아닙니다. 자세한 내용은 이용 약관을 참조하세요.