INVITE-ONLY SCRIPT
BollingerBandsLine
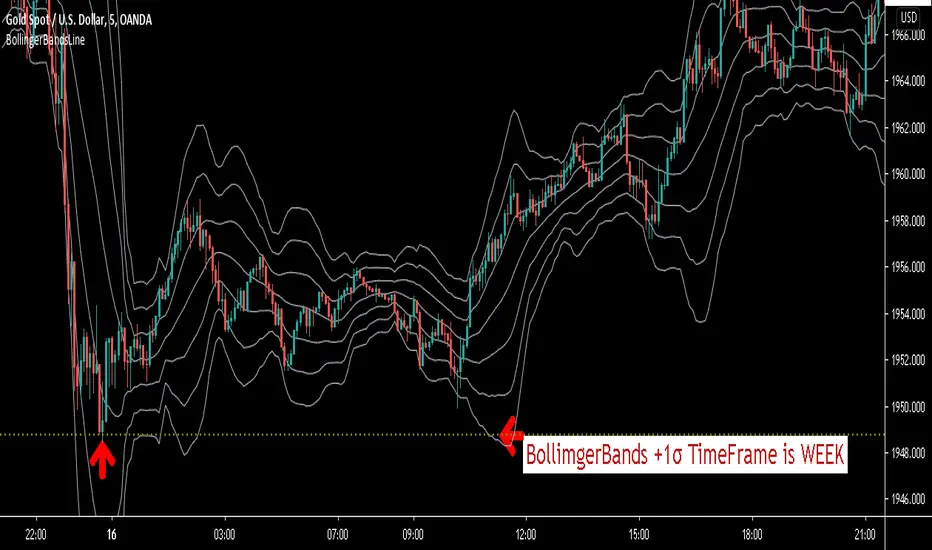
This script will display the price of Bollinger Bands .
For example.See the image above.
You can grasp the price of + 1σ on the weekly chart while looking at the five-minute chart.
You can know the existence of resistance.And you can get the sign of reversal.
This script can display the price of Bollinger Bands for each hour at the same time.
M5,M15,M30,H1,H4,DAY,WEEK,MONTH.
You can also display the price of the middle line for the specified period.
All lines can be changed in color.
You can also specify three Bollinger Bands deviations.
± 1σ is very important in Bollinger Bands .
Once the price goes out of ± 1σ, it may become a trend and start a bandwalk.
Conversely, if the price returns to within ± 1σ, the trend may reverse.
With a line drawn there, this script will help you trade.
If you are interested in the invitation-only indicator, please contact us on private chat.
The following is an explanation in Japanese.
通常のボリンジャーバンドのミドルラインと+1σ、-1σに加えて、
指定した2つの偏差のラインを表示できます。
※デフォルト設定ではミドルラインと±1σ、±2σ、±3σになっています。
5分足・15分足・30分足・1時間足・4時間足・日足・週足・月足のボリンジャーバンドの±1σ、及びミドルラインにリアルタイムで自動的にラインを引いてくれるインジケーターです。
好きな時間足のチャートを見ながら今、各時間足のボリンジャーバンド±1σ、及びミドルラインがどの位置にあるか把握することができます。
各時間足の±1σ、ミドルそれぞれラインの色を変更可能!
必要のない時間足の±1σ及びミドルラインのON・OFFが変更可能!
自分の見やすいようにお好みでアレンジできます!
TradingViewの設定で「インジケーター名ラベル」をオンにすれば、
この水平線がどの時間足のどこの水平線なのか説明が表示されます!
このインジケーターに興味がある方はプライベートチャットで連絡ください。
초대 전용 스크립트
이 스크립트는 작성자가 승인한 사용자만 접근할 수 있습니다. 사용하려면 요청 후 승인을 받아야 하며, 일반적으로 결제 후에 허가가 부여됩니다. 자세한 내용은 아래 작성자의 안내를 따르거나 JoyfullFX에게 직접 문의하세요.
트레이딩뷰는 스크립트의 작동 방식을 충분히 이해하고 작성자를 완전히 신뢰하지 않는 이상, 해당 스크립트에 비용을 지불하거나 사용하는 것을 권장하지 않습니다. 커뮤니티 스크립트에서 무료 오픈소스 대안을 찾아보실 수도 있습니다.
작성자 지시 사항
면책사항
해당 정보와 게시물은 금융, 투자, 트레이딩 또는 기타 유형의 조언이나 권장 사항으로 간주되지 않으며, 트레이딩뷰에서 제공하거나 보증하는 것이 아닙니다. 자세한 내용은 이용 약관을 참조하세요.