OPEN-SOURCE SCRIPT
업데이트됨 Impulse MACD buy OwlPixel
Description:
The Impulse MACD Buy Indicator, developed by OwlPixel, is a powerful trading tool for traders using TradingView's Pine Script version 5. This indicator aims to provide valuable insights for identifying potential buy signals in the market using the popular MACD (Moving Average Convergence Divergence) oscillator.
Key Features:
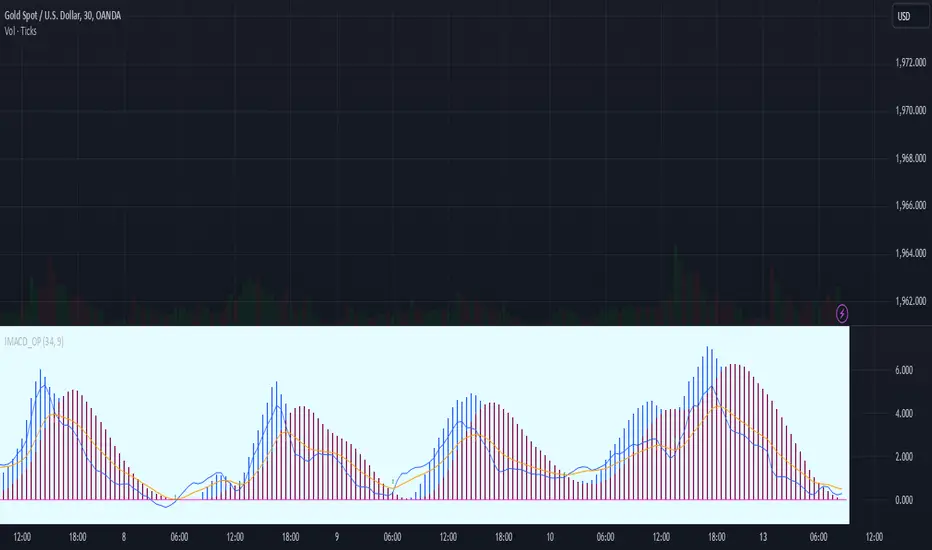
MACD Analysis: The indicator displays the MACD line (blue) and the signal line (orange) on the chart, helping traders assess the momentum and trend direction of an asset.
Impulse Histo: The Impulse Histo (blue histogram) visualizes the difference between the MACD line and the signal line, making it easier to spot changes in market strength and potential trend reversals.
Impulse MACD CD Signal: This histogram (maroon color) highlights the divergence between the Impulse Histo and the signal line, providing further insights into trend shifts.
Background Boxes: The indicator features three rows of different colored background boxes that represent distinct market conditions - an uptrend (light green), a downtrend (light red), and a neutral trend (light yellow).
Crossover Points: Buy signals are marked with green circles when the MACD line crosses above the signal line, suggesting potential entry points for long positions.
Demand and Supply Bars: The demand (lime/green) and supply (red/orange) bars are intensified, aiding traders in identifying possible reversal areas.
Stop Loss and Take Profit:
The Impulse MACD Buy Indicator automatically calculates Stop Loss (SL) and Take Profit (TP) levels for buy signals. The SL level is set at the highest of the last three candles, while the TP level is determined by a user-defined percentage of the closing price. This information helps traders manage risk and optimize their profit potential.
Usage:
Apply the Impulse MACD Buy Indicator to your TradingView chart by copying the provided Pine Script into the Pine Editor.
Configure the input parameters, such as the MA Length and Signal Length, to suit your trading preferences.
Observe the MACD line, signal line, and histograms to gain insights into market momentum and trends.
Identify buy signals when the MACD line crosses above the signal line, signaled by green circles.
Utilize the provided Stop Loss and Take Profit levels for risk management and exit strategies.
Please note that this indicator is for informational purposes only and should be used in conjunction with other analysis techniques to make well-informed trading decisions. Happy trading!
The Impulse MACD Buy Indicator, developed by OwlPixel, is a powerful trading tool for traders using TradingView's Pine Script version 5. This indicator aims to provide valuable insights for identifying potential buy signals in the market using the popular MACD (Moving Average Convergence Divergence) oscillator.
Key Features:
MACD Analysis: The indicator displays the MACD line (blue) and the signal line (orange) on the chart, helping traders assess the momentum and trend direction of an asset.
Impulse Histo: The Impulse Histo (blue histogram) visualizes the difference between the MACD line and the signal line, making it easier to spot changes in market strength and potential trend reversals.
Impulse MACD CD Signal: This histogram (maroon color) highlights the divergence between the Impulse Histo and the signal line, providing further insights into trend shifts.
Background Boxes: The indicator features three rows of different colored background boxes that represent distinct market conditions - an uptrend (light green), a downtrend (light red), and a neutral trend (light yellow).
Crossover Points: Buy signals are marked with green circles when the MACD line crosses above the signal line, suggesting potential entry points for long positions.
Demand and Supply Bars: The demand (lime/green) and supply (red/orange) bars are intensified, aiding traders in identifying possible reversal areas.
Stop Loss and Take Profit:
The Impulse MACD Buy Indicator automatically calculates Stop Loss (SL) and Take Profit (TP) levels for buy signals. The SL level is set at the highest of the last three candles, while the TP level is determined by a user-defined percentage of the closing price. This information helps traders manage risk and optimize their profit potential.
Usage:
Apply the Impulse MACD Buy Indicator to your TradingView chart by copying the provided Pine Script into the Pine Editor.
Configure the input parameters, such as the MA Length and Signal Length, to suit your trading preferences.
Observe the MACD line, signal line, and histograms to gain insights into market momentum and trends.
Identify buy signals when the MACD line crosses above the signal line, signaled by green circles.
Utilize the provided Stop Loss and Take Profit levels for risk management and exit strategies.
Please note that this indicator is for informational purposes only and should be used in conjunction with other analysis techniques to make well-informed trading decisions. Happy trading!
릴리즈 노트
Description:The Impulse MACD Buy Indicator, developed by OwlPixel, is a powerful trading tool for traders using TradingView's Pine Script version 5. This indicator aims to provide valuable insights for identifying potential buy signals in the market using the popular MACD (Moving Average Convergence Divergence) oscillator.
Key Features:
MACD Analysis: The indicator displays the MACD line (blue) and the signal line (orange) on the chart, helping traders assess the momentum and trend direction of an asset.
Impulse Histo: The Impulse Histo (blue histogram) visualizes the difference between the MACD line and the signal line, making it easier to spot changes in market strength and potential trend reversals.
Impulse MACD CD Signal: This histogram (maroon color) highlights the divergence between the Impulse Histo and the signal line, providing further insights into trend shifts.
Background Boxes: The indicator features three rows of different colored background boxes that represent distinct market conditions - an uptrend (light green), a downtrend (light red), and a neutral trend (light yellow).
Crossover Points: Buy signals are marked with green circles when the MACD line crosses above the signal line, suggesting potential entry points for long positions.
Demand and Supply Bars: The demand (lime/green) and supply (red/orange) bars are intensified, aiding traders in identifying possible reversal areas.
Stop Loss and Take Profit:
The Impulse MACD Buy Indicator automatically calculates Stop Loss (SL) and Take Profit (TP) levels for buy signals. The SL level is set at the highest of the last three candles, while the TP level is determined by a user-defined percentage of the closing price. This information helps traders manage risk and optimize their profit potential.
Usage:
Apply the Impulse MACD Buy Indicator to your TradingView chart by copying the provided Pine Script into the Pine Editor.
Configure the input parameters, such as the MA Length and Signal Length, to suit your trading preferences.
Observe the MACD line, signal line, and histograms to gain insights into market momentum and trends.
Identify buy signals when the MACD line crosses above the signal line, signaled by green circles.
Utilize the provided Stop Loss and Take Profit levels for risk management and exit strategies.
Please note that this indicator is for informational purposes only and should be used in conjunction with other analysis techniques to make well-informed trading decisions. Happy trading!
Alert System
The indicator uses the MACD lines (the MACD Line and the Signal Line) to identify trend changes and potential entry points in the market. The MACD is a popular technical indicator that helps traders visualize the relationship between short-term and long-term price trends.
Here's how the alert system works:
Crossover Buy Signal:
When the MACD Line crosses above the Signal Line, it generates a "crossover up" signal.
The indicator plots a green circle on the chart to mark this event.
An alert condition is triggered, and a notification is sent to the trader with the message "MACD crossover: Buy signal!"
Crossover Sell Signal:
When the MACD Line crosses below the Signal Line, it generates a "crossunder down" signal.
The indicator plots a red circle on the chart to mark this event.
An alert condition is triggered, and a notification is sent to the trader with the message "MACD crossover: Sell signal!"
The alerts are valuable for traders as they can be instantly notified when potential trading opportunities arise. A "crossover up" signal suggests a potential bullish trend, indicating a possible entry point for long positions. On the other hand, a "crossunder down" signal suggests a potential bearish trend, indicating a possible entry point for short positions.
Traders can take these alerts as signals to conduct further analysis and make informed trading decisions. It's essential to consider other factors, such as market conditions, price patterns, and support/resistance levels, before executing a trade based solely on the MACD crossover signals.
Keep in mind that no indicator or alert system guarantees profitable trades. The MACD crossover signals are just one tool among many that traders can use to assess market conditions and identify potential opportunities. Successful trading often requires a combination of technical analysis, risk management, and sound trading strategies.
릴리즈 노트
Name updated오픈 소스 스크립트
트레이딩뷰의 진정한 정신에 따라, 이 스크립트의 작성자는 이를 오픈소스로 공개하여 트레이더들이 기능을 검토하고 검증할 수 있도록 했습니다. 작성자에게 찬사를 보냅니다! 이 코드는 무료로 사용할 수 있지만, 코드를 재게시하는 경우 하우스 룰이 적용된다는 점을 기억하세요.
면책사항
해당 정보와 게시물은 금융, 투자, 트레이딩 또는 기타 유형의 조언이나 권장 사항으로 간주되지 않으며, 트레이딩뷰에서 제공하거나 보증하는 것이 아닙니다. 자세한 내용은 이용 약관을 참조하세요.
오픈 소스 스크립트
트레이딩뷰의 진정한 정신에 따라, 이 스크립트의 작성자는 이를 오픈소스로 공개하여 트레이더들이 기능을 검토하고 검증할 수 있도록 했습니다. 작성자에게 찬사를 보냅니다! 이 코드는 무료로 사용할 수 있지만, 코드를 재게시하는 경우 하우스 룰이 적용된다는 점을 기억하세요.
면책사항
해당 정보와 게시물은 금융, 투자, 트레이딩 또는 기타 유형의 조언이나 권장 사항으로 간주되지 않으며, 트레이딩뷰에서 제공하거나 보증하는 것이 아닙니다. 자세한 내용은 이용 약관을 참조하세요.