OPEN-SOURCE SCRIPT
ATR SL and TP with Candle Freeze & DataWindow
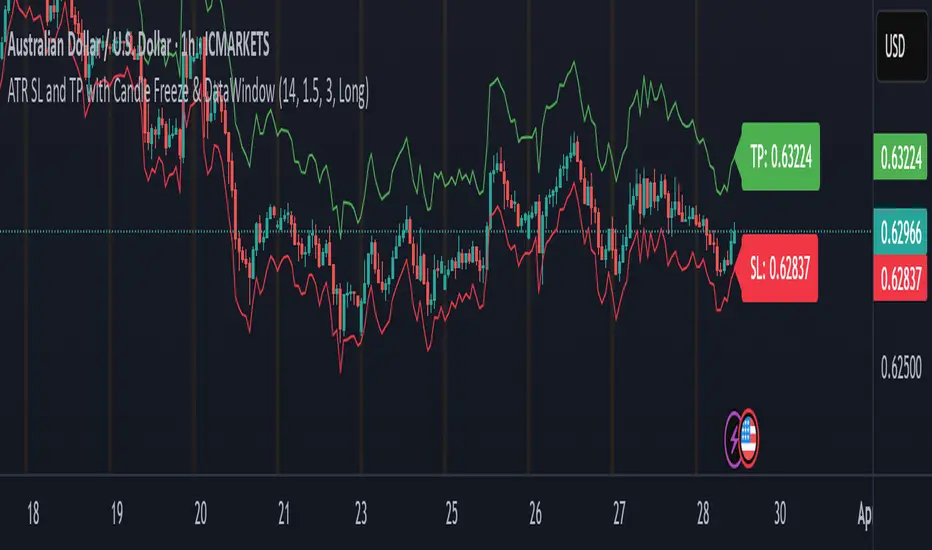
This indicator uses the Average True Range (ATR) to automatically calculate your stop loss (SL) and take profit (TP) levels based on the current market volatility and your chosen multipliers. Here's how it works:
ATR Calculation:
The indicator computes the ATR, which measures the average market volatility over a set period. This value helps gauge how much the price typically moves.
SL and TP Determination:
Depending on whether you're in a long or short trade, the SL and TP are calculated relative to the current price:
For a long trade, the stop loss is set below the current price (by subtracting a multiple of the ATR) and the take profit is set above it (by adding a multiple of the ATR).
For a short trade, the calculations are reversed.
Candle Freeze Feature:
Once a new candle starts, the calculated SL and TP values are "frozen" for that candle. This means they remain constant during the candle's formation, preventing them from updating continuously as the price fluctuates. This can make it easier to plan your trades without the levels shifting mid-candle.
Data Window & Labels:
The SL and TP values are plotted on the chart as lines and displayed in labels for quick reference. Additionally, they appear in TradingView's Data Window, so you can easily copy the price numbers if needed.
Overall, the indicator is designed to help you manage your trades by setting dynamic, volatility-adjusted SL and TP levels that only update at the start of each new candle, aligning with your chosen timeframe. Let me know if you have any more questions or need further adjustments!
오픈 소스 스크립트
트레이딩뷰의 진정한 정신에 따라, 이 스크립트의 작성자는 이를 오픈소스로 공개하여 트레이더들이 기능을 검토하고 검증할 수 있도록 했습니다. 작성자에게 찬사를 보냅니다! 이 코드는 무료로 사용할 수 있지만, 코드를 재게시하는 경우 하우스 룰이 적용된다는 점을 기억하세요.
면책사항
해당 정보와 게시물은 금융, 투자, 트레이딩 또는 기타 유형의 조언이나 권장 사항으로 간주되지 않으며, 트레이딩뷰에서 제공하거나 보증하는 것이 아닙니다. 자세한 내용은 이용 약관을 참조하세요.
오픈 소스 스크립트
트레이딩뷰의 진정한 정신에 따라, 이 스크립트의 작성자는 이를 오픈소스로 공개하여 트레이더들이 기능을 검토하고 검증할 수 있도록 했습니다. 작성자에게 찬사를 보냅니다! 이 코드는 무료로 사용할 수 있지만, 코드를 재게시하는 경우 하우스 룰이 적용된다는 점을 기억하세요.
면책사항
해당 정보와 게시물은 금융, 투자, 트레이딩 또는 기타 유형의 조언이나 권장 사항으로 간주되지 않으며, 트레이딩뷰에서 제공하거나 보증하는 것이 아닙니다. 자세한 내용은 이용 약관을 참조하세요.