PROTECTED SOURCE SCRIPT
업데이트됨 EPS & Sales/Revenue Growth Marker
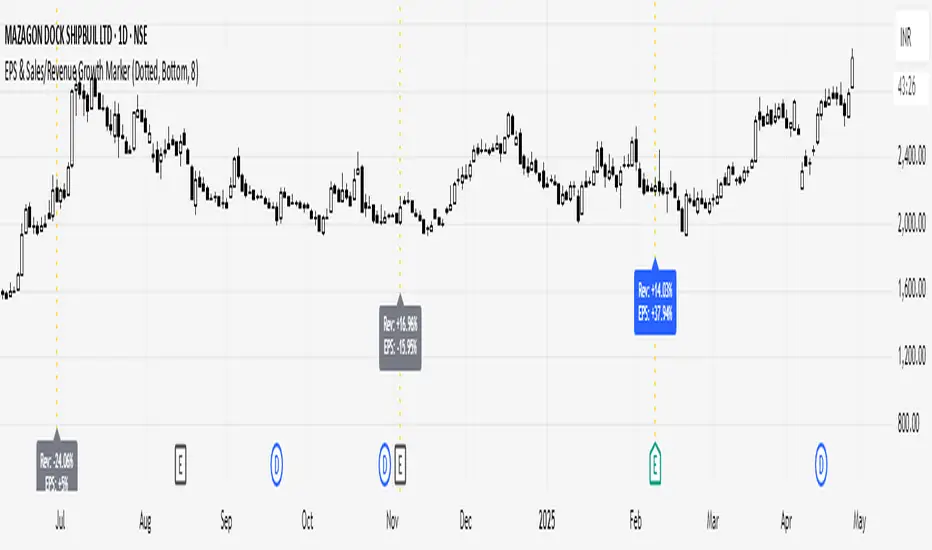
This script plots the Revenue Growth and EPS Growth % on Earnings Date.
Idea Credit: Special thanks to dharmeshrbhatt for inspiring the concept behind this tool.
Developed and Published by learningvitals.
Idea Credit: Special thanks to dharmeshrbhatt for inspiring the concept behind this tool.
Developed and Published by learningvitals.
- Plots Revenue Growth % and EPS Growth % on earnings date.
- Choose label position: Above Bar, Below Bar, Top, or Bottom.
- Customizable growth colors based on combined EPS and Revenue performance.
- Customizable line style and colors.
- Controls max number of labels to keep the chart clean.
릴리즈 노트
- Added + sign display for positive Revenue Growth % and EPS Growth % values.
- No change to core functionality or layout.
릴리즈 노트
Improved Detection of Earnings EventsIn this update, the script has been enhanced to detect earnings events more reliably.
Earlier, it mainly relied on official earnings data. Now, even if official earnings data is unavailable for a stock, the script can still detect earnings events using changes in financial figures like Revenue and EPS.
This ensures that the growth markers (vertical lines and labels) continue to appear consistently without missing important events, even for stocks with incomplete data.
As a result, you get better visibility of Revenue and EPS growth trends across a wider range of stocks!
보호된 스크립트입니다
이 스크립트는 비공개 소스로 게시됩니다. 하지만 제한 없이 자유롭게 사용할 수 있습니다 — 여기에서 자세히 알아보기.
면책사항
이 정보와 게시물은 TradingView에서 제공하거나 보증하는 금융, 투자, 거래 또는 기타 유형의 조언이나 권고 사항을 의미하거나 구성하지 않습니다. 자세한 내용은 이용 약관을 참고하세요.
보호된 스크립트입니다
이 스크립트는 비공개 소스로 게시됩니다. 하지만 제한 없이 자유롭게 사용할 수 있습니다 — 여기에서 자세히 알아보기.
면책사항
이 정보와 게시물은 TradingView에서 제공하거나 보증하는 금융, 투자, 거래 또는 기타 유형의 조언이나 권고 사항을 의미하거나 구성하지 않습니다. 자세한 내용은 이용 약관을 참고하세요.