OPEN-SOURCE SCRIPT
Slope Vortex
I stumbled upon creating this and thought it was cool and worth sharing. If anyone has ever dabbled with the Aroon or Vortex Indicators, there is some similarity to how it can be used visually.
The indicator basically takes two slopes from the trailing time period you indicate- one from the highest point in that time period, and one from the lowest point. It then plots both.
Here are some of the ways I think this indicator can be used--
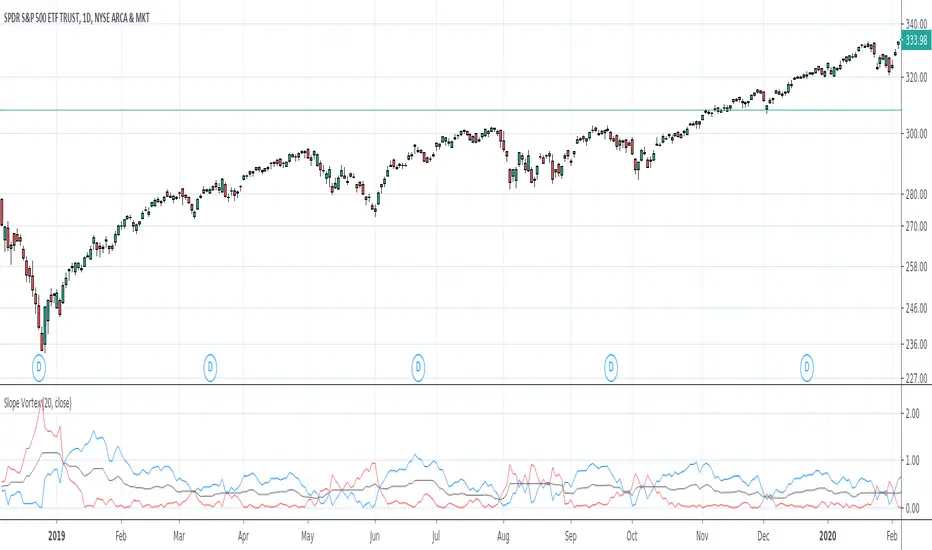
Here are some snippets of examples I outlined-


I purposely kept this indicator as clean and simple as possible for publication. But I already have tinkered around with taking the output and putting it through the likes of RSI, Stoch, etc. and I think the outcomes are pretty intriguing as well for something so simple. I think dropping the length too much makes it too noisy, so 20, 50, 100 look most useful.
The indicator basically takes two slopes from the trailing time period you indicate- one from the highest point in that time period, and one from the lowest point. It then plots both.
Here are some of the ways I think this indicator can be used--
- Crossover This is the most obvious way, visually. If the blue line crosses under the red, an uptrend has ended or is testing support here. The opposite can be used as well. When the blue line crosses above the red an uptrend is starting or it is testing resistance.
- Trending or Ranging If the two bands are moving away from each other/increasing the width between them, there is definite trending action going on. If the two are very narrow or keep crossing each other, whatever symbol you're looking at is likely ranging or consolidating. The black "midpoint" line can also be used to help identify-- if this line is moving up, regardless of if the blue or red band is above, the trend has momentum; if it is going down or flat the previous trend is either slowing greatly or we are ranging.
- Support & Resistance Crosses can identify meaningful support and resistance. Having both lines kiss or get very close to the black midpoint line but not cross can also indicate S/R or confirm trend strength.
Here are some snippets of examples I outlined-
I purposely kept this indicator as clean and simple as possible for publication. But I already have tinkered around with taking the output and putting it through the likes of RSI, Stoch, etc. and I think the outcomes are pretty intriguing as well for something so simple. I think dropping the length too much makes it too noisy, so 20, 50, 100 look most useful.
오픈 소스 스크립트
트레이딩뷰의 진정한 정신에 따라, 이 스크립트의 작성자는 이를 오픈소스로 공개하여 트레이더들이 기능을 검토하고 검증할 수 있도록 했습니다. 작성자에게 찬사를 보냅니다! 이 코드는 무료로 사용할 수 있지만, 코드를 재게시하는 경우 하우스 룰이 적용된다는 점을 기억하세요.
면책사항
해당 정보와 게시물은 금융, 투자, 트레이딩 또는 기타 유형의 조언이나 권장 사항으로 간주되지 않으며, 트레이딩뷰에서 제공하거나 보증하는 것이 아닙니다. 자세한 내용은 이용 약관을 참조하세요.
오픈 소스 스크립트
트레이딩뷰의 진정한 정신에 따라, 이 스크립트의 작성자는 이를 오픈소스로 공개하여 트레이더들이 기능을 검토하고 검증할 수 있도록 했습니다. 작성자에게 찬사를 보냅니다! 이 코드는 무료로 사용할 수 있지만, 코드를 재게시하는 경우 하우스 룰이 적용된다는 점을 기억하세요.
면책사항
해당 정보와 게시물은 금융, 투자, 트레이딩 또는 기타 유형의 조언이나 권장 사항으로 간주되지 않으며, 트레이딩뷰에서 제공하거나 보증하는 것이 아닙니다. 자세한 내용은 이용 약관을 참조하세요.