INVITE-ONLY SCRIPT
업데이트됨 Sniper BB Scope 9x v2.0
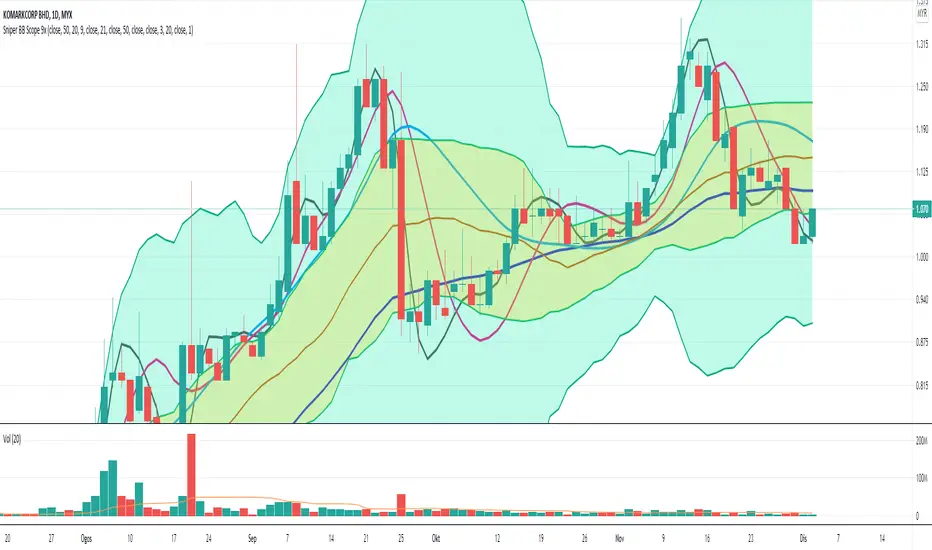
This indicator is combination of two indicators;-
1- BB
2- HMA
Component of BB and the improvement
- combining two BB with different standard deviation that will help trader to identify the range of the price movement. The BB seperate by different colors background so that will help trader to easyly find the price trend.
1. Outer BB - dark green background with dark green line boundaries
- bb breakout with volume if reach the upper bb will have potential to surfing upper BB. But please double confirm with others indi for the momentum. If reach peak, then possible to going back to Upper Inner BB or mid BB.
2. Inner BB - yellow background with light green line boundaries
- can act as nearest support if price going retrace from upper BB. Sometime, the price retrace a bit and making support here before push to higher price.
3. Black line
- cross up candle can buy
- cross down candle can sell
4. Red line
- cross up candle can buy
- cross down candle can sell
5. Blue line act as strong support and resistant for the long term position
- If candle trading below blue line, the blue line will act as resistant.
- If candle trading above blue line, the blue line will act as support.
The signal indication
Strong buy signal
When both black and red line cross up the blue line.
Strong sell signal
When both black and red line line cross down the blue line.
릴리즈 노트
update - revised more accurate multiple hma calculation
릴리즈 노트
Adding lag hma 50초대 전용 스크립트
이 스크립트는 작성자가 승인한 사용자만 접근할 수 있습니다. 사용하려면 요청 후 승인을 받아야 하며, 일반적으로 결제 후에 허가가 부여됩니다. 자세한 내용은 아래 작성자의 안내를 따르거나 bids_sniper에게 직접 문의하세요.
트레이딩뷰는 스크립트의 작동 방식을 충분히 이해하고 작성자를 완전히 신뢰하지 않는 이상, 해당 스크립트에 비용을 지불하거나 사용하는 것을 권장하지 않습니다. 커뮤니티 스크립트에서 무료 오픈소스 대안을 찾아보실 수도 있습니다.
작성자 지시 사항
면책사항
해당 정보와 게시물은 금융, 투자, 트레이딩 또는 기타 유형의 조언이나 권장 사항으로 간주되지 않으며, 트레이딩뷰에서 제공하거나 보증하는 것이 아닙니다. 자세한 내용은 이용 약관을 참조하세요.
초대 전용 스크립트
이 스크립트는 작성자가 승인한 사용자만 접근할 수 있습니다. 사용하려면 요청 후 승인을 받아야 하며, 일반적으로 결제 후에 허가가 부여됩니다. 자세한 내용은 아래 작성자의 안내를 따르거나 bids_sniper에게 직접 문의하세요.
트레이딩뷰는 스크립트의 작동 방식을 충분히 이해하고 작성자를 완전히 신뢰하지 않는 이상, 해당 스크립트에 비용을 지불하거나 사용하는 것을 권장하지 않습니다. 커뮤니티 스크립트에서 무료 오픈소스 대안을 찾아보실 수도 있습니다.
작성자 지시 사항
면책사항
해당 정보와 게시물은 금융, 투자, 트레이딩 또는 기타 유형의 조언이나 권장 사항으로 간주되지 않으며, 트레이딩뷰에서 제공하거나 보증하는 것이 아닙니다. 자세한 내용은 이용 약관을 참조하세요.