PROTECTED SOURCE SCRIPT
업데이트됨 Tradveller Pivot
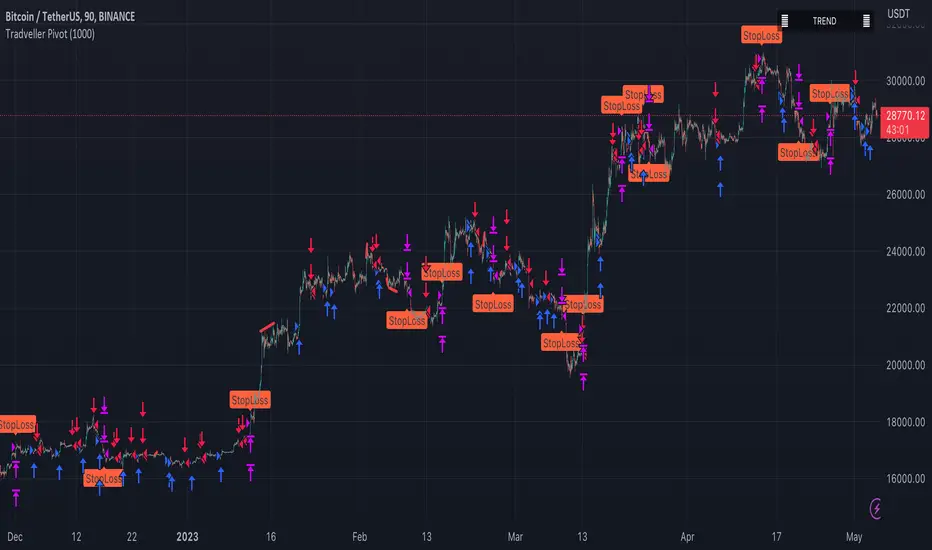
A pivot strategy is a trading technique that involves identifying key price levels, called pivot points, where a financial instrument is likely to experience a change in direction. Pivot points serve as potential support and resistance levels, which can help traders make informed decisions on when to enter or exit positions, set stop-loss or take-profit orders, and gauge market sentiment.
The pivot point itself is calculated using the high, low, and closing prices of the previous trading period (usually daily, but it can be applied to any timeframe). Once the pivot point is determined, additional support and resistance levels can be calculated around it. There are several methods to calculate these levels, with the most common being the classic, Woodie's, Camarilla, and Fibonacci methods.
A pivot strategy usually involves the following steps:
Calculate the pivot point and support and resistance levels using one of the methods mentioned above.
Observe the market price action and identify if the price is trading above or below the pivot point. If the price is above the pivot point, it indicates bullish sentiment, while trading below the pivot point suggests bearish sentiment.
Use the support and resistance levels to identify potential entry and exit points. Traders might consider buying when the price approaches a support level and selling when it approaches a resistance level.
Set stop-loss orders and take-profit targets based on the calculated levels, ensuring proper risk management.
Pivot strategies can be used in various market conditions and timeframes, and they often work well in combination with other technical analysis tools and indicators. However, like any trading strategy, it's essential to use proper risk management techniques and understand that no strategy guarantees success in every trade.
릴리즈 노트
A pivot strategy is a trading technique that involves identifying key price levels, called pivot points, where a financial instrument is likely to experience a change in direction. Pivot points serve as potential support and resistance levels, which can help traders make informed decisions on when to enter or exit positions, set stop-loss or take-profit orders, and gauge market sentiment.The pivot point itself is calculated using the high, low, and closing prices of the previous trading period (usually daily, but it can be applied to any timeframe). Once the pivot point is determined, additional support and resistance levels can be calculated around it. There are several methods to calculate these levels, with the most common being the classic, Woodie's, Camarilla, and Fibonacci methods.
A pivot strategy usually involves the following steps:
Calculate the pivot point and support and resistance levels using one of the methods mentioned above.
Observe the market price action and identify if the price is trading above or below the pivot point. If the price is above the pivot point, it indicates bullish sentiment, while trading below the pivot point suggests bearish sentiment.
Use the support and resistance levels to identify potential entry and exit points. Traders might consider buying when the price approaches a support level and selling when it approaches a resistance level.
Set stop-loss orders and take-profit targets based on the calculated levels, ensuring proper risk management.
Pivot strategies can be used in various market conditions and timeframes, and they often work well in combination with other technical analysis tools and indicators. However, like any trading strategy, it's essential to use proper risk management techniques and understand that no strategy guarantees success in every trade.
보호된 스크립트입니다
이 스크립트는 비공개 소스로 게시됩니다. 하지만 이를 자유롭게 제한 없이 사용할 수 있습니다 – 자세한 내용은 여기에서 확인하세요.
在交易的世界裡沒有真理,在上帝的眼中也沒有隨機。
면책사항
해당 정보와 게시물은 금융, 투자, 트레이딩 또는 기타 유형의 조언이나 권장 사항으로 간주되지 않으며, 트레이딩뷰에서 제공하거나 보증하는 것이 아닙니다. 자세한 내용은 이용 약관을 참조하세요.
보호된 스크립트입니다
이 스크립트는 비공개 소스로 게시됩니다. 하지만 이를 자유롭게 제한 없이 사용할 수 있습니다 – 자세한 내용은 여기에서 확인하세요.
在交易的世界裡沒有真理,在上帝的眼中也沒有隨機。
면책사항
해당 정보와 게시물은 금융, 투자, 트레이딩 또는 기타 유형의 조언이나 권장 사항으로 간주되지 않으며, 트레이딩뷰에서 제공하거나 보증하는 것이 아닙니다. 자세한 내용은 이용 약관을 참조하세요.